Send this article to a friend:
December
12
2014

|
Send this article to a friend: December |
|
Current Price of Silver $50: Based On The Historic Oil-Silver Ratio
The current price of silver should be $50 an ounce, based on the historic 1960’s oil-silver ratio. Unfortunately, this is not the case as the world has siphoned the majority of its wealth into the highly leveraged financial paper industry… one that has no future. When the world was based more on a “Physical Economy”, and not the current Financial-Derivatives Market, the price of silver (and gold for that matter) was closely tied to the price of oil. This can been seen in the chart below:
With the huge price volatility in the current energy markets, very few people realize the price of oil remained unchanged for a decade in the 1960’s. The only volatility experienced in the oil market is when the price of oil fell from $1.90 a barrel in 1961 to $1.80 from 1962-1970. Basically, the world experienced ample oil supplies allowing for long-term contracts set at a single price of many years. During the 1960’s, silver was still used as official currency in the United States. After Lyndon Johnson signed the 1965 Coinage Act removing silver from circulation, the price of silver was actually higher than a barrel of oil: Oil vs Silver Price(1966) Oil = $1.80 vs Silver = $1.29 (1967) Oil = $1.80 vs Silver = $2.06 (1968) Oil = $1.80 vs Silver = $1.96 (1969) Oil = $1.80 vs Silver = $1.81 So, for a brief period, the Oil-Silver ratio was below one at 0.9/1 in 1967 and 1968. Amazingly, an ounce of silver could buy a little more than a barrel of oil during these three years. The overall average Oil-Silver ratio for the entire 1960’s decade was 1.3/1. This was at a time when silver was used as real money in the United States. After U.S. oil production peaked in 1970, long-term oil contracts were over for good. Furthermore, the Arab oil embargo was an additional factor that pushed the price of oil from $2.24 a barrel in 1971 to $11.58 a barrel in 1974. This also had a profound impact on the price of silver as it jumped from $1.39 in 1971 to $4.39 in 1974.
The Oil-Silver ratio (in RED) increased to 3.0/1 in 1977 as the price of oil increased to $13.92 a barrel while the price of silver traded at an average $4.71 for the year. It wasn’t until 1979, did the Oil-Silver ratio fall back towards the 1960’s average hitting 1.5/1 as the price of silver skyrocketed to $21.79 compared to $31.61 for a barrel of oil. NOTE: all these figures are average prices for the year. If you ask most people why the price of silver reached nearly $50 in January 1980, they will say it was due to the Hunts trying to corner the silver market. As I stated in previous articles on this same subject matter… WHO CORNERED THE OIL & GOLD MARKET??? I mean, how on earth did the price of oil increase to an average high of $36 in 1980 up from $2.24 in 1971, while gold averaged $612 versus $40.80 during the same time period?? No one ever asks that question. The price of silver increased substantially during the 1970’s decade to keep up with oil price inflation. Sure, the Hunts were buying a lot of silver as an inflation hedge on their Libyan oil profits, but much of the gains in silver came at the latter part of the decade when many large investors and institutions came into the silver market. Regardless, the overall Oil-Silver ratio was 2.1/1 for the 1970’s decade… a bit higher than the 1.3/1 ratio during the 1960’s decade. However, we must remember the silver spike in 1979 to an average of $21.79 was not a speculative anomaly, but rather the market’s attempt to value silver more to its historic 1960’s oil-silver ratio. The Highly Leveraged Paper Finance-Derivative Market Destroyed The Oil-Silver Ratio In order to keep the faith in the world’s fiat monetary system, investors wealth was siphoned into a highly leveraged financial-derivatives market. This impacted not only the value of the precious metals, but also the entire commodities market as well. Basically, Dollars invested into a Digital Paper Financial Market, were Dollars not invested into hard assets such as precious metals and commodities.> This had a profound impact on the Oil-Silver ratio. This next chart shows the Oil-Silver ratio from 2000-2014:
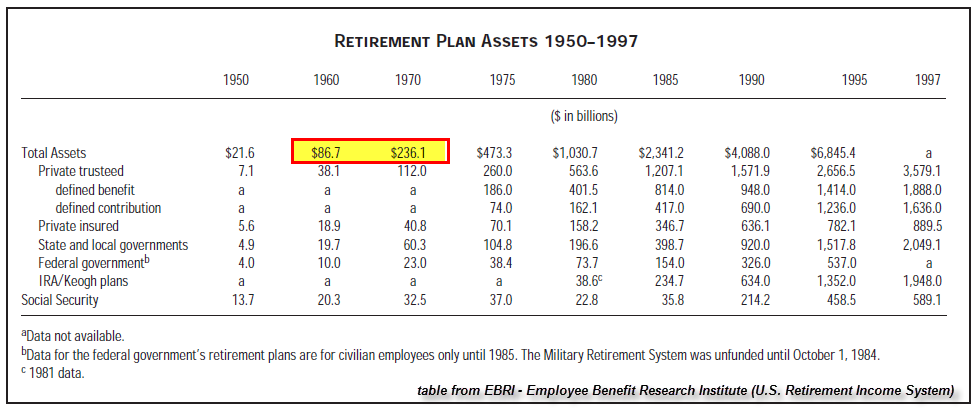
As we can see, the Oil-Silver ratio increased from 5.8/1 in 2000 to a peak of 7.5/1 in 2005. It wasn’t until 2011, when silver nearly reached $50 did the Oil-Silver ratio fall to a low of 3.2/1 for the 2000-2014 period. This was still much higher than either the 1/3/1 1960’s average ratio or the 2.1/1 for the 1970’s average ratio. Of course, silver reaching $49 in 2011 was touted as a BLOW-OFF TOP by the typical paper traders. It took a record 5 consecutive silver margin hikes by the CME Group to finally get silver down in the mid $30 range. To this day, I never believed $50 silver reached in 2011 was a SPECULATIVE SPIKE, but rather a market returning to a more physical-based price mechanism.Unfortunately, the highly leveraged paper markets still control the valuations of ALL ASSETS. Fortunately, this will not continue forever. If we look at the next two charts, we can plainly see where the majority of Americans have placed their wealth. In 1960, the total value of the U.S. Retirement Market was $86.7 billion. This increased to $236 billion in 1970:
By the following decade, the total U.S. Retirement Market increased more than four times in value to over $1 trillion in 1980. You can find this data on the EBRI pdf. Furthermore, if we look the most recent ICI – Investment Company Institute’s Q2 2014 update, we have the following:
Total U.S. Retirement Market assets increased 24 times from $1 trillion in 1980 to $24 trillion in Q2 2014. Now, lets compare these figures to price of gold and silver. 1980 vs 2014 U.S. Retirement Assets vs. Gold & Silver1980 U.S. Retirement Market = $1 trillion 1980 Average Price of Gold = $612 1980 Average Price of Silver = $16.39 2014 U.S. Retirement Market = $24 trillion 2014 Average Price of Gold = $1,270 2014 Average Price of Silver = $19.23 Since 1980, the value of the U.S. Retirement Market increased 24 times, while gold doubled from $612 to $1,270 and silver increased a little less than three dollars from $16.39 to $19.23. Again, these are average annual prices. Here we can see that while gold and silver are both undervalued severely compared to the gains in the U.S. Retirement Market, silver hasn’t budged much at all…. after 34 years. If were to take the 1960’s average Oil-Silver ratio of 1.3/1 and see how it would impact the price of silver from 2000-2014, this would be the result:
According to the 1960’s Oil-Silver ratio of 1.3/1, the price of silver would have peaked in 2011 at $85.58, and would still be $50 with the current price of a barrel of oil at $64. Even if we were to use the 1970’s average Oil-Silver ratio of 2.1/1, that would give us a current price of silver at $30… almost double than what it is today. The U.S. & Global Retirement Markets are being propped up by the Fed and foreign central banks. Without this continued manipulation, the value of most paper assets would implode. Furthermore, the coming peak of global oil production will be the final nail in the CENTRAL BANK’S COFFIN. As the value of the highly leveraged financial-derivatives market heads south in earnest, investors will be forced to move back into hard assets, such as the precious metals and commodities. This will push the value of these assets up to levels thought unimaginable. $50 silver is coming… however that will probably be just the beginning stage of a much higher price in the future. Please check back for new articles and updates at the SRSrocco Report. You can also follow us at Twitter below:
|
|---|
Send this article to a friend:
 |
 |
 |