
Send this article to a friend:
November
02
2018

|
Send this article to a friend: November |
|
Silver Needs To Make A Move - A Halloween Head Fake Inspired By The Dollar
After gold broke above the top end of its trading range on October 11, silver remained under its high from early October at $14.95. Silver appears to be biding its time before it finally decides to make a move. For those who do not trade in the highly leveraged and volatile futures arena which is the most direct route for participation in the silver market, the Velocity Shares 3X long silver ETN instrument (USLV) and its complementary product on the downside (DSLV) offer alternatives to the futures market. Silver needs to make a move to reflect the recent price action in gold that would validate a recovery in the path of least resistance of the two precious metals, but since early October the price action has been sleepy. A decline, a rejection, a nap, and a head fake Silver hit its most recent low in mid-September when the price fell below the $14 per ounce level for the first time since January 2016.
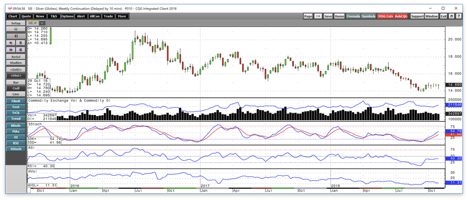
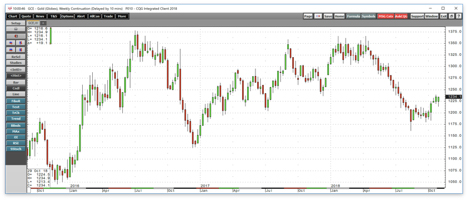
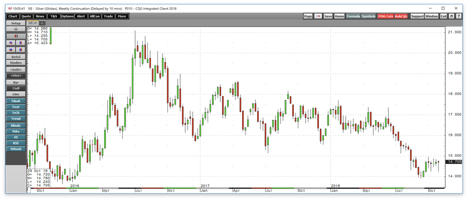
As the weekly chart highlights, silver fell within 27.5 cents of the level of critical technical support at the December 2015 low at $13.635 per ounce. However, after a bounce from the low, the price of silver rose to a high of $14.95 on October 2, and price momentum crossed higher and was in neutral territory as of October 26. The relative strength index displays a neutral condition and price volatility at 11.31% on the weekly chart is a lot closer to the lows that the highs this year. Silver dropped to a low at a level that had not traded in almost three years, recovered, and over recent sessions that market has been jumpy falling to $14.24 on the final day of October and rising back to the $14.70 level on November 1. Meanwhile, the action in the gold market also ended October on a bearish note and began November with a rally. Silver could hold the key to gold Gold traded down to $1213.40 on October 31 and rallied to a high of over $1234 on November 1. The dollar index traded to a new high at just under the 97 level on the final day of October and retreated by over 0.750 on November 1 sending the prices of gold and silver higher. Meanwhile, gold broke to the upside in mid-October, but it could be waiting for silver to play catchup before it adds to recent gains. Source: CQG The weekly chart for COMEX gold futures illustrates that the precious metal has posted gains over the past five consecutive weeks. During the week of October 8, gold put in a bullish key reversal trading pattern on the weekly pictorial as it made a lower low than the previous week and closed at a higher high compared to the prior week. Gold followed through on the upside over the next two weeks, and during the week of October 22, it once again put in a bullish key reversal. If the price of the precious metal can end this week above $1238.60, it will put in a third reversal to the upside given the price action on Halloween which spooked many longs and caused them to run from the gold market. Gold could be in a position to challenge the 50% retracement level of the move from $1365.40 to $1161.40 at $1263.40 per ounce. Meanwhile, above the early October peak at $14.95 in the silver market, the next resistance level stands at $15.07, the August 28 high on the December futures contract. To break the pattern of lower highs and lower lows, silver will need to rise above that level which would provide a level of validation for the price action in the gold market. The silver-gold ratio is trading at its highest level in a quarter of a century at the 84:1 level. Source: CQG As the monthly chart shows, it currently takes 84 ounces of silver to purchase one ounce of gold. The long-term average for the price relationship dating back to 1974 stands at the 55:1 level or 55 ounces of silver value in each ounce of gold value. Silver is historically inexpensive compared to gold, or the price of the yellow metal is historically too high these days. For gold to continue to make strides on the upside, we will likely need to see a delayed move to the upside in the silver market. A long habit of all quiet before the stormA combination of fundamental and technical factors determines the path of least resistance for gold and silver prices. However, in both markets it is investment demand that tends to have the final say with it comes to driving the price higher or lower. Silver volatility tends to be higher than the measure in the gold market because of silver's lower price and its penchant to move more on a percentage basis because speculators tend to flock to the silver futures market when a price trend emerges. A break above the $15.07 or below the $13.635 per ounce levels would likely increase the participation of speculators in the silver market. On November 1, silver was trading a lot closer to the high end of the range than the lows. With gold trending higher, it may be only a matter of time before silver breaks higher. However, the prospects for higher interest rates and a dollar that is flirting with its highest level in 2018 stand as factors that could push the prices of both gold and silver lower over the coming weeks. Additionally, price history in 2015, 2016, and 2017 points to lower prices during the final month of the year. December could be a critical monthGold negated a bullish price pattern of higher lows than the price that traded during the previous December in 2018. In 2016, the price of the precious metal never fell below the December 2015 bottom at $1046.20. In 2017, gold did not come close to the late 2016 bottom at $1123.90. However, in 2018 the precious metal fell below its December 2017 low at $1236.50 and fell to a low of $1161.40 in August before its latest recovery. When it comes to silver, the price pattern was less pronounced as silver violated its 2016 low in 2017 when the price dropped below the $15.15 level which was below the end of 2016 low at $15.70. Source: CQG The weekly chart shows that silver has been making lower highs and lower lows since trading at $21.095 in July 2016. To break that pattern, $15.07 is a far cry from the critical level of technical resistance in the silver market which is at $17.35, the June 2018 high, but it would be the first step when it comes to building price momentum. In June, the high was just one cent below the mid-April peak at $17.36 which kept the bearish trading pattern intact and sent silver to levels below $14 per ounce in September. The history of price weakness in both gold and silver during the final month of previous years is a cautionary sign for the metals, but it also presents an opportunity for a surprise which could cause volatility to increase dramatically. Three reasons to buy silver and to use the triple-leveraged ETN products There are three reasons why I believe silver has a chance to challenge the $15.07 level and move appreciably higher over the coming days and weeks and why risk-reward favors a short-term long position in the silver market at this time. The first reason is the technical position on the weekly chart which rejected a brief move to test prices below the $14 level. Price momentum has shifted higher which could attract a return of trend-following longs who begin to fund the risk-reward of the silver market compelling. The second reason is that risk-reward balance. While critical technical support stands at $13.635, above the $15.07 level, the next area of resistance is at the June high at $17.35 per ounce. At $14.70, there is $1.065 of risk and the potential for $2.65 of rewards in the silver market, a better than 2:1 risk-reward balance in the silver market these days. Moreover, if silver finds a way to move above $17.35, it would break the bearish pattern that has been in place since the July 2016 peak at over $21 per ounce. The final reason is that silver is a metal where expecting the unexpected and a contrarian view tends to pay the most significant rewards. Right now, few market participants are looking for silver to move to the upside. However, the recent corrective price action in the stock market has increased fear and uncertainty in markets and ignited a flight to quality assets which caused the price of gold to move to a higher short-term high. While gold is trading at a 25 year high against silver, each time it has reached peaks in 1993, 2003, 2008, and 2016, the ratio has corrected by at least 17 points. A move of just 10 points that takes the ratio to 74:1 would put silver at the $16.20 per ounce level with gold at $1200, below the current market price for the yellow metal. Silver has been sleeping, but the odds favor an awakening sooner rather than later in the historically volatility precious metal. I will be trading silver on a short-term basis, from the long side over the coming sessions with tight stops. I will be trading in the COMEX futures market and via the triple-leveraged USLV and DSLV ETN products. The fund summary for USLV states:
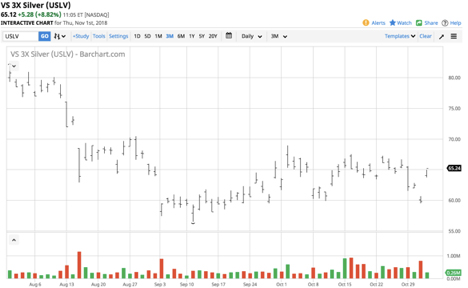
The fund summary for DSLV is the inverse of USLV. Both products use leverage in the futures and options market in an attempt to provide triple the results of the silver market. The price for leverage is time decay which means that both instruments are only appropriate for short-term long and short positions as time is their worst enemy and a quiet silver market will eat away at the value of both USLV and DSLV as they are susceptible to reverse splits. Silver experienced a significant short-term rally from the low on October 31 at $14.24 to the high on November 1 at $14.71 per ounce on the nearby futures contract, a rose of 3.3%. Source: CQG Overnight, USLV rose from $59.49 to a high of $65.37 or 9.9% which was triple the move in the silver futures market. The short-term results in DSLV are similar during selloffs in the silver futures market. The price action in silver has been sleeping over recent weeks even though gold has been moving gently higher. A bit of a spooky head fake move in both metals on Halloween inspired by a new high in the dollar index gave way to a precious metals rally on November 1. Time will tell if silver follows its precious cousin with a break to the upside, but eventually the silver market will move, and USLV and DSLV are tools that nimble traders with their fingers on the pulse of the market can employ to take advantage of the market once volatility returns to the metal that is always full of surprises. The Hecht Commodity Report is one of the most comprehensive commodities reports available today from the #2 ranked author in both commodities and precious metals. My weekly report covers the market movements of 20 different commodities and provides bullish, bearish and neutral calls; directional trading recommendations, and actionable ideas for traders. More than 120 subscribers are deriving real value from the Hecht Commodity Report. Disclosure: I/we have no positions in any stocks mentioned, and no plans to initiate any positions within the next 72 hours. I wrote this article myself, and it expresses my own opinions. I am not receiving compensation for it (other than from Seeking Alpha). I have no business relationship with any company whose stock is mentioned in this article. Additional disclosure: The author always has positions in commodities markets in futures, options, ETF/ETN products, and commodity equities. These long and short positions tend to change on an intraday basis.
|
Send this article to a friend:
 |
 |
 |


![[Most Recent Quotes from www.kitco.com]](http://www.kitconet.com/charts/metals/gold/t24_au_en_usoz_2.gif)
![[Most Recent USD from www.kitco.com]](http://www.weblinks247.com/indexes/idx24_usd_en_2.gif)
![[Most Recent Quotes from www.kitco.com]](http://www.kitconet.com/charts/metals/silver/t24_ag_en_usoz_2.gif)