
Send this article to a friend:
November
06
2017

|
Send this article to a friend: November |
|
Market Report: Silver Stars
Prices were weak on Monday and Tuesday, recovered on Wednesday, and were drifting slightly lower at 0800 GMT this morning. It may only be coincidence, but prices often weaken ahead of and on Tuesdays, which are when the Commitment of Traders data is collected. It appears to tie in with the bullion banks’ attempts to window-dress positions for their internal reporting. This being the case, it is likely that a serious buyer would wait for this price effect before buying. This is what appeared to happen in the case of silver, catching the market wrong-footed on Wednesday. Base metals this week were strong, which would have also influenced silver, but less so gold. Nickel was particularly strong, and it is now being more widely accepted that the commodity cycle has turned, and so on a medium-term view we are going to see higher prices. While the weekly trading pattern, of weak Mondays and Tuesdays followed by better Wednesdays and Thursdays, was visible this week, there are other factors, which override this effect. Gold is the other side of the coin from the dollar, and some traders were talking about the dollar having completed a head-and-shoulders reversal, which is bullish for the dollar, bearish for gold. But a look at volumes fails to confirm: the first shoulder should see high volume, the head similar levels of volume, and the second shoulder distinctly less. It appeared to be the other way around, negating the analysis. It is silver which should hold our attention. The next chart, of Comex open interest and the silver price, is notable.
Open interest has been rising, while the price has been drifting lower since mid-October. This is unusual, because a falling price normally reflects the closing of speculators’ long positions, which leads to falling open interest. What this chart tells us is that lower prices have encouraged net accumulation of long positions. An examination of the underlying data in the COT reports shows that since the price low in July, the greatest change by far is in the hedge funds shorts. They have been squeezed to some extent by other hedge funds taking long positions. On the surface, it has been hard to work out why open interest has remained so strong, and it turns out this is a large part of the reason. This week saw the Bank of England raise its lending rate by 0.25% to 0.5%, the first rise in over a decade. Inflation is 50% over target, and unemployment is the lowest it’s been for a long time. Yet, two members of the Monetary Policy Committee voted for no change. Such is the madness of central bank groupthink.
|
Send this article to a friend:
 |
 |
 |
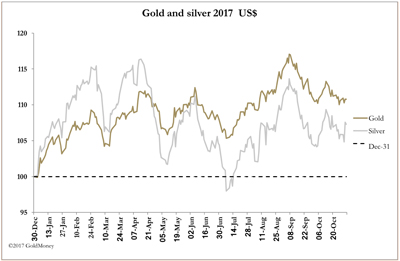 Gold and silver prices steadied this week, with gold up $3 since last Friday’s close at $1275 in early European trade this morning (Friday). Gold lagged the other precious metals, and this was particularly noticeable in the case of silver, which on Wednesday jumped 42 cents (2.5%). Silver rose a net 24cents on the week to $17.09.

![[Most Recent Quotes from www.kitco.com]](http://www.kitconet.com/charts/metals/gold/t24_au_en_usoz_2.gif)
![[Most Recent USD from www.kitco.com]](http://www.weblinks247.com/indexes/idx24_usd_en_2.gif)
![[Most Recent Quotes from www.kitco.com]](http://www.kitconet.com/charts/metals/silver/t24_ag_en_usoz_2.gif)