
Send this article to a friend:
November
03
2017

|
Send this article to a friend: November |
|
An attempt to quantify the immeasurable
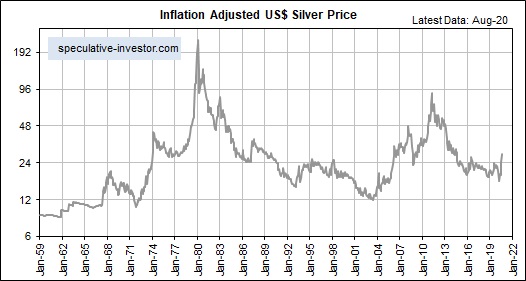
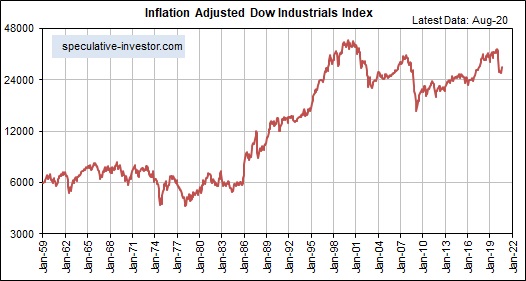
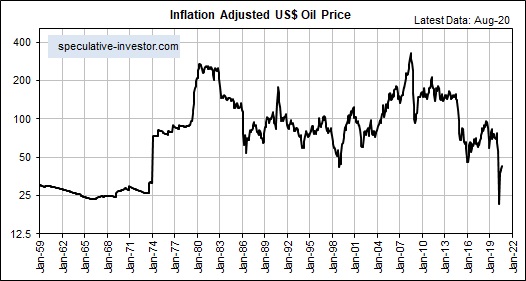
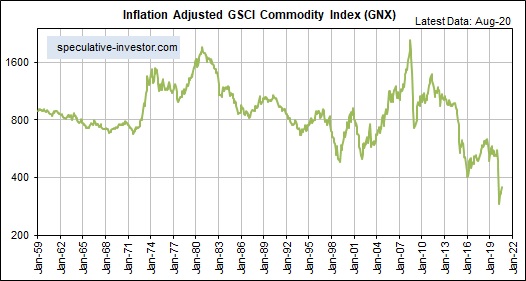
Such a number doesn’t exist because a sensible result cannot be arrived at by summing or averaging the prices of disparate items. For example, it makes no sense to average the prices of a car, a haircut, electricity, a house, an apple, a dental checkup, a gallon of gasoline and an airline ticket. And yet, that is effectively what the government does — in a complicated way designed to make the end result lower than it otherwise would be — when it determines the CPI. The government concocts economic statistics for propaganda purposes, but even the most honest and rigorous attempt to use price data to determine a single number that consistently paints an accurate picture of money purchasing power will fail. It must fail because it is an attempt to do the impossible. The goal of determining real (inflation-adjusted) performance is not completely hopeless, though, because we know what causes long-term changes in money purchasing power and we can roughly estimate the long-term effects of these causes. In particular, we know that over the long term the purchasing power of money falls due to increased money supply and rises due to increased population and productivity. By using the known rates of increase in the money supply and the population and a ‘guesstimate’ of the rate of increase in labour productivity we can arrive at a theoretical rate of change for the purchasing power of money. Due to potentially-large oscillations in the desire to hold cash and to the fact that changes in the money supply can take years to impact the cost of living, this theoretical rate of purchasing-power change will tend to be inaccurate over periods of two years or less but should approximate the actual rate of purchasing-power change over periods of five years or more. I’ve been using the theoretical rate of purchasing power change, calculated as outlined above, to construct long-term inflation-adjusted (IA) charts for about eight years now. Here are the updated versions of some of these charts, based on data as at the end of October-2017.
|
Send this article to a friend:
 |
 |
 |
 To paraphrase Einstein, not everything worth measuring is measurable and not everything measurable is worth measuring. The purchasing power of money falls into the former category. It is worth measuring, in that it would be useful to have a single number that consistently reflected the economy-wide purchasing power of money. However, such a number doesn’t exist.
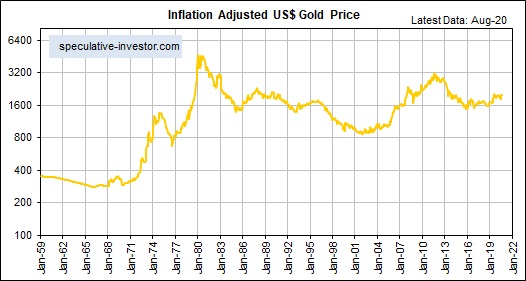

![[Most Recent Quotes from www.kitco.com]](http://www.kitconet.com/charts/metals/gold/t24_au_en_usoz_2.gif)
![[Most Recent USD from www.kitco.com]](http://www.weblinks247.com/indexes/idx24_usd_en_2.gif)
![[Most Recent Quotes from www.kitco.com]](http://www.kitconet.com/charts/metals/silver/t24_ag_en_usoz_2.gif)