
Send this article to a friend:
October
10
2020

|
Send this article to a friend: October |
|
Is Gold Cheap At $2000 An Ounce?
As spot gold prices zipped past $2,000 per ounce recently, it portended a historical moment that implies a lot more than a nice round number on the price of a commodity. As I will explain, what lies ahead is a disorderly change in the world’s monetary system and one that will eventually bring back gold as the lynchpin around which world commerce functions. For more than 100 years, gold was viewed as a barbaric relic—but we will see gold rise like a phoenix from the ashes of the US dollar and other fiat currencies. Many commentators have pointed out the similarities between what is happening today and what occurred during the stagflationary seventies (1971–1981) and the Great Depression of the thirties (1929–1946). But what we will experience is a combination of the two. Consumer price inflation is going to be much higher when compared to the 1970s, and the GDP contractions are going to be more pronounced than what we witnessed during the 1930s. In fact, the 2019 US GDP of $21.4 trillion will not be eclipsed, in real terms, at least for another decade, if not for a much longer time span. What lies ahead for the US economy is not a V- or a W- or an L-shaped recovery but a long, downward-inclined staircase which could lead to an abyss. With our current trajectory, that is not only a possibility but the most probable outcome. Barring dramatic changes to monetary and fiscal policies—which is the exact opposite of what has been pursued in a bipartisan manner over the last few decades—the US dollar would not only lose its status as the world’s reserve currency but would more than likely meet the fate of the Continental. The Misesian “Crack-Up Boom” The underpinnings of the above scenario can be best described by the “crack-up boom” that Ludwig Von Mises postulated. As he explains in his book, Human Action:
In other words, there are two specific pre-conditions for an economy to undergo a crack-up boom:
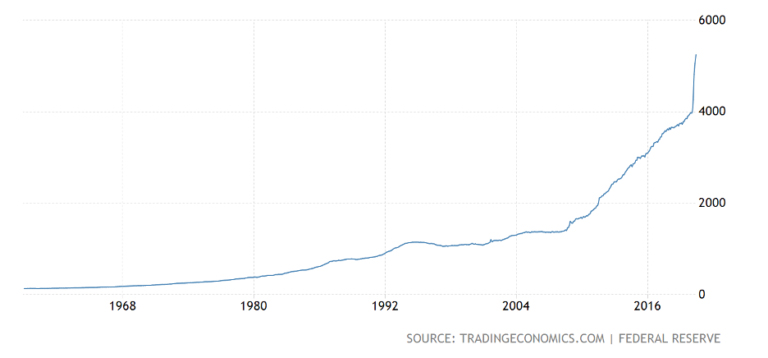
The Crack-Up Boom is no longer a forecast. In fact, the US Fed Crossed the Rubicon of choosing Option B (i.e., accelerate the expansion of money supply) when it started the rate cuts in July 2019 (referred to as “insurance cuts” by Powell) and QE4 (“not QE” according to Powell). All of this happened pre-COVID. All that COVID did was provide an impetus to the expansion. COVID provided a very academically convenient cover. Had COVID really been a giant pandemic (and I do not subscribe to this view at all– but that’s a different discussion altogether) as is being claimed by the WHO, CDC, and governments around the world, then the appropriate response should have been a contraction of the money supply not an expansion of the money supply. It is only under the perverse perceptions of Keynesian economics that every issue in the world requires monetary easing. So what are the signs that prove we are living through a Crack-Up Boom? By definition, it would be a steep expansion in the money supply. But even the bond vigilantes no longer seem interested in tracking that number these days. The most likely mainstream indicator is going to be the recognition of a double-digit Misery Index (inflation + unemployment) within a 12-to 18-month window. Measured accurately, both inflation (i.e., “16% trimmed-mean CPI” instead of CPI or core-CPI) and unemployment (“U6” instead of “U3”) would each likely be in double digits in that time window. The Fed has been clamoring for inflation for the last few years, and the markets are about to give them a poignant reminder of “Be Careful What You Wish For.” US Fed in Full Throttle If ever one was dismissive about the possibility of a Crack-Up Boom, a glance at the money supply chart would eliminate any lingering doubt. From its inception in 1913 to the beginning of 2020, the Fed’s M1 had reached $4 trillion dollars. Before the end of this year, it will likely hit $6 trillion dollars. That means 50% of the money it has created in all of its 107-year history would be created in just this calendar year. Below is the history of M1 growth since the creation of the Fed and the acceleration over the last few months: While the COVID crisis played a large role in this acceleration, now that the bubble has been pricked, there is no going back. The dominoes that are lined up—housing bubble 2.0, auto bubble, student loan bubble, NASDAQ 2.0 bubble, junk bond bubble—will ensure constant infusions of monetary heroin by the Fed to keep the zombie economy afloat. The number of bailouts that will be required over the next few months pretty much guarantees that the M1 growth will stay on the current trajectory. This is a bipartisan issue. It makes no difference whether Trump or Biden becomes president in 2021. Is Gold Cheaper at $2000 an ounce in 2020 than it was at $35 in 1971? Fundamental to this comparison is the recognition that gold is money and that the Fed’s notes that circulate today have value only because they represent a claim against money. For a relative comparison of gold prices between today and 1971, we can ignore the various technical factors that ought to be used to value gold—like, should we use M1 or M2, or what percent backing should be considered? If we compare the money supply ratios M12020 / M11971 or M22020 / M21971, we can see that these are up about 30 times. Gold prices, on the other hand, are up about 60 times, so it looks relatively fairly valued. But what this comparison ignores are some critical differences between then and now—i.e., the future direction of money supply growth, the political will to tolerate higher interest rates, and a relatively strong US economy that could afford the higher interest rates.
If we account for these factors, one could make a rational claim that gold at $2,000 an ounce in 2020 is cheaper than $35 an ounce in 1971. Regarding the valuation of gold itself, today’s fractional reserve banking system makes the old, but important, distinctions between demand (checking) and time (savings) deposits quite fungible. Therefore, whether M1 or M2 has to be backed by money becomes a debatable issue. Besides, historically, a 40% backing of currency in circulation by money provided a “relatively” stable monetary system. Of course, it can be rightfully argued that anything less than a 100% backing constitutes inflation by definition, which is theft. Let’s take the case of M1, which is about $5 trillion. If this were to be backed 100%, then the 261.5Moz of gold held by the US government would have to be valued at about $20,000/ounce or about 10x the current price. Depending on the various combinations of percentage backing and M1/M2 for our calculations, we could get a multiple of anywhere between 4 and 30x. So, at a minimum, gold prices have to go up at least 4x. Of course, the biggest tailwind behind gold prices is the future inflation that will be created by the Fed. It’s conservative to conclude that the money supply will go up only 5x during the 2020 to 2030 decade (or about 18% CAGR). In the context of recent events, such a conservative assumption should be considered naïve, and even bordering on stupidity. What combination would I use to value gold? 100% backing of M1 would be the base case scenario, in my opinion. What I can safely say is that the world will witness at least a 5-digit price of gold this decade, in which the first digit will not be “1”. Gold prices today mean a whole lot more than just a number. They indicate a tumultuous future of monetary breakdown with tremendous social and economic upheavals. * * * The recent breakout in the price of gold is just the beginning. Gold is set to skyrocket in the months ahead. That’s why legendary speculator Doug Casey just released this urgent new video which outlines exactly how he is positioned to profit from a rare opportunity, and how you could join him in making enormous profits. Even a small amount of money put into the right stocks today could deliver life-changing rewards. Click here to watch it now.
|
Send this article to a friend:
 |
 |
 |

![[Most Recent Quotes from www.kitco.com]](http://www.kitconet.com/images/live/s_gold.gif)
![[Most Recent USD from www.kitco.com]](http://www.weblinks247.com/indexes/idx24_usd_en_2.gif)
![[Most Recent Quotes from www.kitco.com]](http://www.kitconet.com/images/live/s_silv.gif)