
Send this article to a friend:
August
29
2019

|
Send this article to a friend: August |
|
Gold Price Forecast: Gold Price Around Labor Day
Let’s start with discussion what tends to happen on the gold market after the US Labor Day.
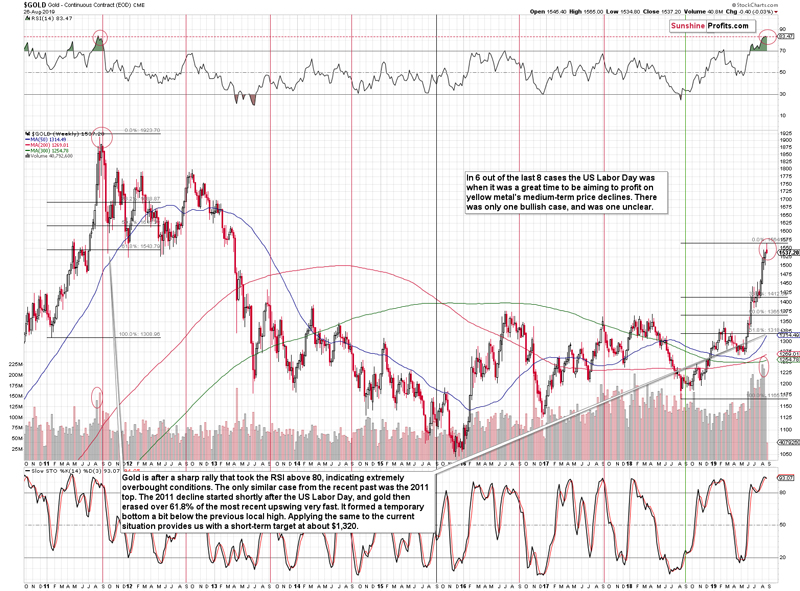
In short, something special is often happening on the gold market around the US Labor Day. In almost all cases, gold is either topping or already after a nearby top. In other words, it’s perfectly set for a major decline in the following weeks, and sometimes, months. In 6 out of the last 8 cases the US Labor Days was were great times to be aiming to profit on yellow metal's medium-term price declines. There was only one bullish case (in 2018), and was one unclear (in 2015, when gold moved higher in the short run, but then declined anyway). Consequently, it appears that it’s high time for gold to end its recent rally. This analogy in terms of time as a building bridge to yet another analogy that becomes obvious once you take a look at the RSI indicator in the upper part of the chart. It’s currently above the 80 level. There was only one other case in the previous years when we saw something similar. It was at the 2011 top. The 2011 top is usually just mentioned as the 2011 top, or THE top, as it was the most prominent high of the past decades, so there’s no way to mistake it for a different high. Consequently, it’s easy to forget when did exactly this top take place. The initial high took place on August 23, 2011, and the final (THE) top took place on September 6, 2011 (the first session after the US Labor Day). Interestingly, the August 13, 2019 session was very volatile overall, which might be similar (to a smaller extent, but still) to the initial August 2011 top. To summarize, gold is after a sharp rally that took the RSI above 80, indicating extremely overbought conditions, and the only similar case from the recent past is the 2011 top. The 2011 decline started shortly after the US Labor Day, and gold then erased over 61.8% of its most recent upswing – and very fast. It formed a temporary bottom a bit below the previous local high. Gold didn’t move to its 50-day moving average at that time. The 61.8% Fibonacci retracement of the most recent rally is at $1,318. The most recent local high is at about $1,350. The 50-day gold moving avwrage is at about $1,315 right now. Consequently, applying the 2011 details to the current situation provides us with a short-term target at about $1,320. This is where gold is likely to move next before bouncing. It’s likely to then decline once again, but since no market moves up or down in a straight line, we’re adjusting our exit target for the current short position to accommodate the above – we’re moving them to $1,332, in order to maximize the chance of realizing the trade. Before summarizing, please note that if we discount all the price moves surrounding the early September without looking exactly at this particular date, we get a picture in which gold might be topping right now or a one in which it has already topped.
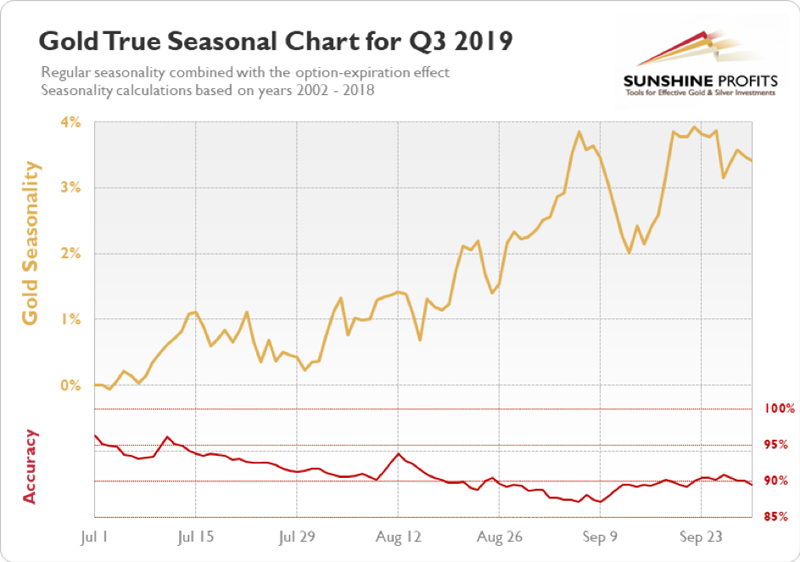
Our gold seasonality charts show that the rally in the yellow metal might already be over. The accuracy of the prediction (i.e. the difference between the previous cases) is relatively big right now, so it’s unclear whether the top is already in or not, but please note how the accuracy rises after the first part of September, along with lower predicted gold prices. This means that whenever the top forms (whether it formed yesterday, will it form on Tuesday right after the US Labor Day, or anytime in between), gold is already likely to be much lower in mid-September. By the way we are transforming the way the True Seasonals section works on our website, so it might be a good idea to visit it (it’s free). The gold seasonality section is ready, and we will add more sections shortly. We also improved the Correlation Matrix section – we made the text more straightforward and we added sample uses. And we made it available to everyone. We strived to make these sections as easy to use as possible, but if something is unclear, please tell us, we’ll be happy to improve them. Summary Summing up, given what gold tends to do around – and in particular after – US Labor Day, it seems that betting on higher gold prices here will not be rewarded. Gold is likely to move much higher in the following years, perhaps based on a recession, but not before declining substantially first as the USD Index soars. On a short-term note, USD’s almost immediate comeback on Monday and gold’s reversal suggest that both markets are barely reacting to additional trade threats. This means that such news is unlikely to prevent the main trends (up for the USD and down for gold) from unfolding for much longer, if at all. Let’s keep in mind that taking the big investment picture into account, out of the following: gold, silver, gold stocks, silver stocks, the recent upswing was visible only in case of gold. Most of the precious metals portfolio: silver, gold miners, and silver miners suggest that what we saw in the last several months is nothing more than a corrective upswing within a bigger downtrend. We know that these are not pleasant times for anyone who refuses to jump on the bullish bandwagon just because prices are moving higher, but what’s profitable is rarely the thing that feels good initially. In those circumstances, we simply cannot forecast gold at higher prices in the medium term. There will most likely be times when gold is trading well above the 2011 highs, but they are unlikely to be seen without being preceded by a sharp drop first. Naturally, the above is up-to-date at the moment of publishing and the situation may – and is likely to – change in the future. If you’d like to receive follow-ups to the above analysis, we invite you to sign up to our gold news newsletter. You’ll receive our articles for free and if you don’t like them, you can unsubscribe in just a few seconds. Sign up today. Przemyslaw Radomski, CFA Editor-in-chief, Gold & Silver Fund Manager
Sunshine Profits enables anyone to forecast market changes with a level of accuracy that was once only available to closed-door institutions. It provides free trial access to its best investment tools (including lists of best gold stocks and silver stocks), proprietary gold & silver indicators, buy & sell signals, weekly newsletter, and more. Seeing is believing.
|
Send this article to a friend:
 |
 |
 |

![[Most Recent Quotes from www.kitco.com]](http://www.kitconet.com/charts/metals/gold/t24_au_en_usoz_2.gif)
![[Most Recent USD from www.kitco.com]](http://www.weblinks247.com/indexes/idx24_usd_en_2.gif)
![[Most Recent Quotes from www.kitco.com]](http://www.kitconet.com/charts/metals/silver/t24_ag_en_usoz_2.gif)