Silver Prices – The Next Five Years
Gary Christenson
Breaking News: COMEX paper gold contracts closed on Friday, June 21, at $1,400.10, up from $1,274 on May 22. Silver closed at $15.29, up from $14.41 on May 29. The S&P 500 Index hit a new all-time high on June 20.
Gold closed at its highest price since 2013.
What Happens Now?
- We don’t know. Both metals have disappointed for years. We expect much higher prices, but they could disappoint again.
- But the more important question is: Are the COMEX prices for paper silver a fair value for the metal, or are they misrepresentative of what prices should be in this economy?
- Should silver prices be higher or lower?
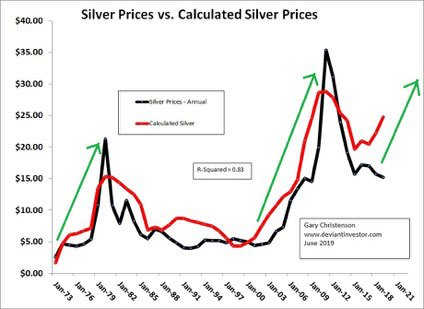
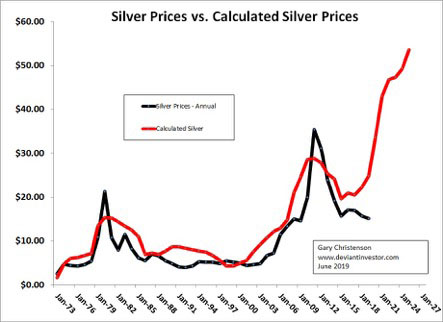
- Consider the following graph of actual silver prices (each annual data point is the average of about 250 daily prices) and calculated silver prices based on an updated empirical model.
WHAT THIS GRAPH DOES NOT DO:
- It is an empirical model, NOT a mathematical proof. It guarantees nothing. While the model has worked for five decades, it could become less effective tomorrow, next year, or never.
- It is NOT a price prediction for paper silver contracts on the COMEX.
- It is NOT a timing model. You shouldn’t TRADE based on this model.
WHAT THIS GRAPH DOES:
- The model shows an estimated value for (annual average) silver prices based on macroeconomic variables. It is a valuation model.
- The model avoids using gold or silver prices to produce calculated silver prices.
- The calculated silver model uses official national debt, crude oil, and the S&P 500 Index as inputs.
Test the Assumptions:
- Silver prices rise, along with most other prices, as the banking cartel devalues the dollar. A proxy for inflationary price increases is the official U.S. National Debt adjusted for population.
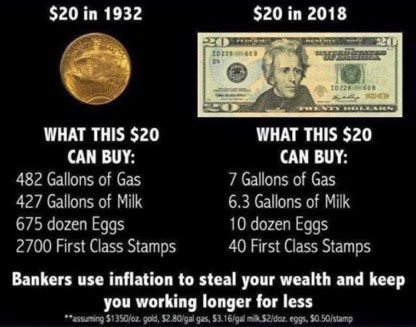
- Official National Debt in 1971 was $400 billion. Today it exceeds $22,000 billion – over $22 trillion. Debt and prices will increase until the financial system breaks or resets.
- Silver prices rise along with crude oil, the most important global commodity.
- Crude oil sold for $2.00 in 1971. Today it sells for $55.00. It peaked at $147 in 2008. Crude oil prices rise because the banking cartel devalues the dollar and when commodities are more desired than paper assets.
- Over the long-term, commodity prices, including oil and silver, rise and fall opposite to the S&P 500 Index. When investors favor stocks (and paper investments) commodity prices are often weak. When commodity prices are strong, stocks are often weak. The model assumes that silver prices are mildly, but inversely, affected by the S&P 500 Index.
Assumptions Summary:
- Silver prices move higher as population adjusted national debt increases. (Dollar devaluation drives all prices higher.)
- Silver prices move higher and lower with crude oil, another commodity.
- Silver prices move opposite to the S&P 500 Index. (Investor preference for commodities versus paper assets.)
- The model weighs and combines these macroeconomic variables to produce a “calculated silver price.” Call it a “fair value” price.
Examine the graph (again) of silver prices and calculated silver prices for nearly five decades.
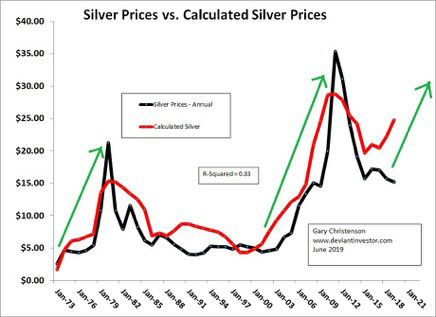
- Calculated prices approximately match the annual average of daily silver prices.
- Calculated prices may bottom and rally several years before the paper silver price bottoms and moves upward.
- Calculated annual prices don’t reach silver’s high and low daily prices because daily prices spike too high and crash lower.
- Buying for the long term makes sense when daily silver prices are low compared to the “calculated” price. (Think 2019.)
- Selling a part of core positions is sensible when daily prices are well above “calculated” prices, such as in 2011.
Silver Prices in Five Years?
- The model depends upon national debt (will be much higher), crude oil prices (higher—maybe) and the S&P 500 Index (flat—maybe).
- We know national debt will rise rapidly. A 100-year average increase is almost 9% per year, every year. Current economic conditions, no credible spending restraints, and the coming recession will boost deficits and debt into the stratosphere.
- Crude oil prices rise and fall. They reached $147 in 2008 but traded below $11 in 1998. Mid-East tensions and inflationary expectations are rising. It’s reasonable to expect crude oil prices will not fall much from current levels and might rise considerably.
- The S&P 500 has risen from 100 in the 1960s. It is overvalued today and likely to fall, but in the long-term it will rise as dollars are devalued. Assume it corrects and then rises slowly. Remember, the S&P 500 collapsed over 50% after its 2007 high.
THE RESULTS:
Additional Reading:
“Somebody” Finally Cares About Gold – Taggart
What to Expect From the Fed – Hemke
CONCLUSIONS:
- The model tells us that silver prices are inexpensive in late June 2019 by about 40%.
- Silver prices should rise in the next five years. The model, depending on assumptions for crude oil prices and the S&P 500, suggests a fair value of $40 to $60 in five years. A spike to one hundred dollars is reasonable.
- Daily prices could spike much higher (double or triple) than the fair value price or fall 25% to 40% below fair value.
- This model is not a prediction or guarantee. It is a valuation model. It could lose accuracy tomorrow, but it has a nearly five-decade history of success.
- Correlation for the annual model since 1971 is 0.91. The R-Squared value is 0.83.
- Buy when the market price is lower than the calculated silver price. Sell when market prices drastically exceed calculated fair value, such as in late 1979, early 1980, and April 2011.
Miles Franklin will convert dodgy fiat debt-based dollars into physical metal that has preserved wealth for millennia. The silver valuation model says buy during 2019 because silver prices are about 40% below fair value. Call Miles Franklin at 1-800-822-8080.
Gary Christenson
The Deviant Investor

Gary Christenson is the owner and writer for the popular and contrarian investment site Deviant Investor and the author of several books, including “Fort Knox Down!” and “Gold Value and Gold Prices 1971 – 2021.” He is a retired accountant and business manager with 30 years of experience studying markets, investing, and trading. He writes about investing, gold, silver, the economy, and central banking. His articles are published on Deviant Investor as well as other popular sites such as 321gold.com, peakprosperity.com, goldseek.com, dollarcollapse.com, brotherjohnf.com, and many others.
deviantinvestor.com
|


![[Most Recent Quotes from www.kitco.com]](http://www.kitconet.com/charts/metals/gold/t24_au_en_usoz_2.gif)
![[Most Recent USD from www.kitco.com]](http://www.weblinks247.com/indexes/idx24_usd_en_2.gif)
![[Most Recent Quotes from www.kitco.com]](http://www.kitconet.com/charts/metals/silver/t24_ag_en_usoz_2.gif)


