
Send this article to a friend:
June
30
2018

|
Send this article to a friend: June |
|
Fed Unwinding the Bernanke Experiments: Progress Report
In this research report, we will examine the evolution of Fed policy as the Federal Open Market Committee (FOMC) seeks to create a sustainable approach to managing an economy no longer requiring emergency measures. Specifically, we will study:
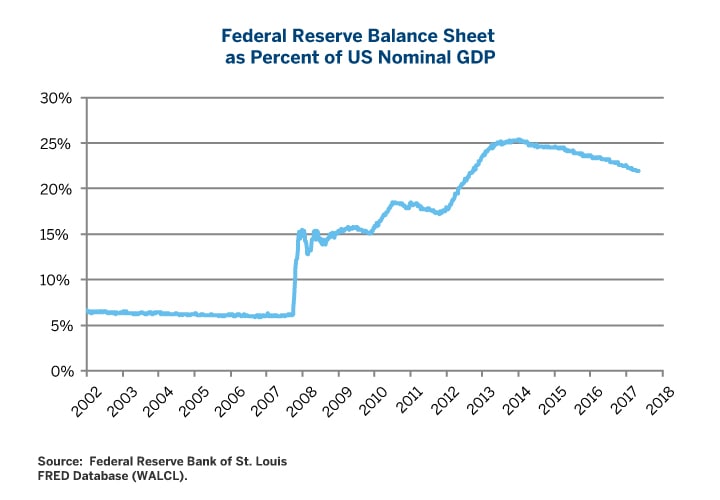
The Fed may have some interesting surprises up its sleeve for 2019. The pieces of this puzzle need to be put together in a precise order. As one contemplates the optimal size of the Fed’s balance sheet, one is led to an equally important examination of what constitutes a neutral monetary policy. Appreciating the nuances of neutral monetary policy forms the foundation of challenging the way the Fed pays interest on reserves and puts emphasis on the inadequacies of the federal funds rate as the primary policy target rate. It is going to be a very interesting debate. The Fed’s balance sheet peaked at $4.516 trillion in January 2015, just above 25% of GDP. By not replacing the full amount of maturing securities, the Fed will continue to allow a steady shrinkage of its balance sheet for the next four or five years, down to around $2.5 to $3 trillion, after which the desired size of the balance sheet will be reviewed and adjusted. There is no accepted theory relating to the optimal size of a central bank’s balance sheet. Before the financial panic of 2008, the Fed’s balance sheet was close to just 6% of GDP. By comparison, the European Central Bank (ECB) was around 12% pre-2008, and is now close to 35%. The Bank of Japan (BoJ) was closer to 25% pre-2008, and even in 2012. It was not until 2013 that the BoJ embarked on an aggressive quantitative easing program; but when it did, it went full throttle. The BoJ’s balance sheet is now almost 95% of annual GDP.
Our best estimate is that the Fed will evolve toward a view that the balance sheet should only be modestly larger than pre-crisis levels. The Fed in the 2020s may or may not choose to impose higher reserve requirements than in the pre-2008 period, yet even so, this perspective suggests the Fed may eventually opt for a smaller balance sheet scenario – perhaps in the range of 10% of GDP during non-crisis environments or around $2.5 trillion by 2022-2023, assuming steady growth in nominal GDP.
The shrinking of the Fed’s balance sheet is being done entirely by not replacing a portion of maturing securities. That is, the Fed has not and is highly unlikely to ever make outright sales from its Treasury debt or Mortgage-Backed Securities (MBS) portfolio. This strategy of gradual shrinkage with no outright sales has been well advertised and has been well received by the markets.
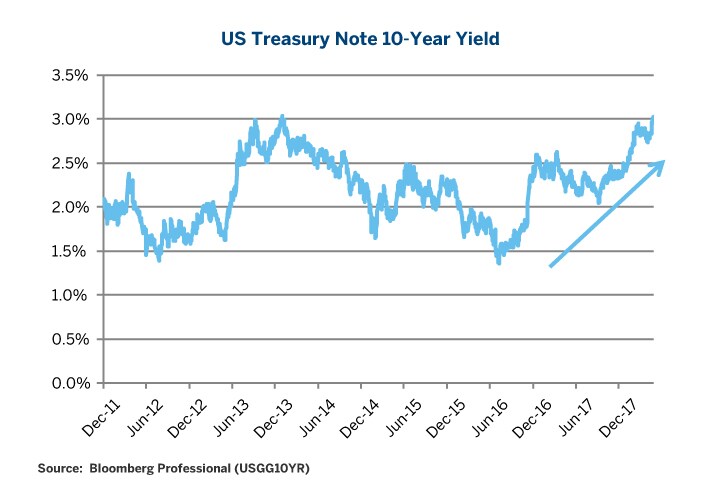
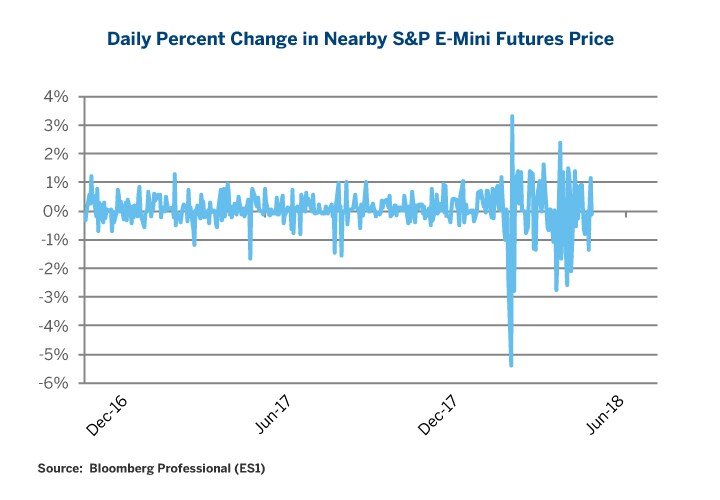
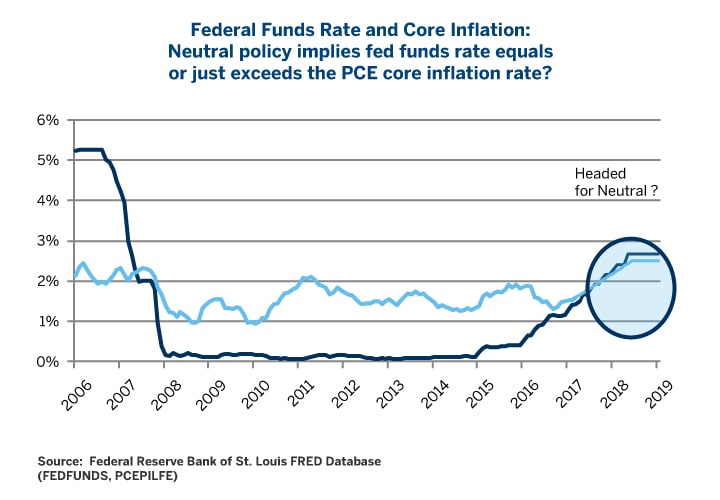
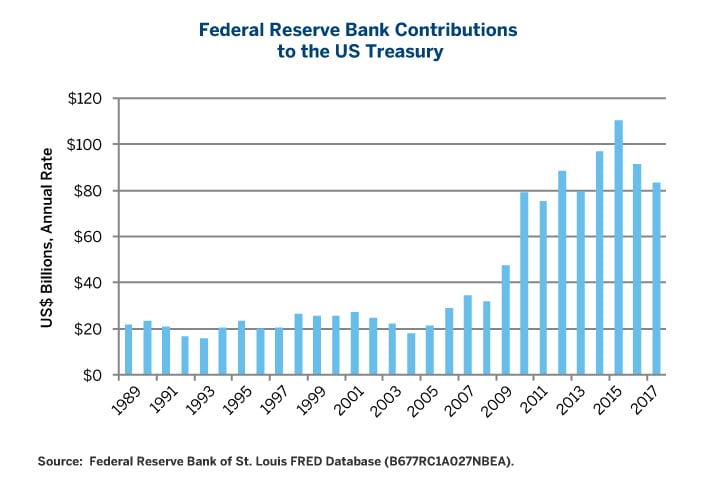
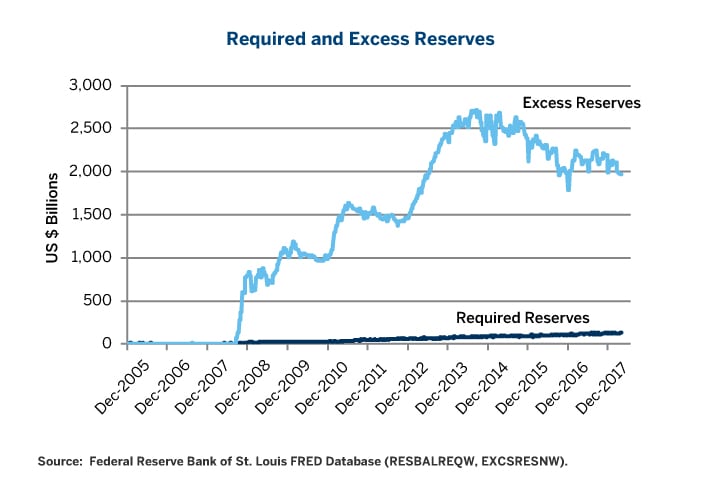
It is not easy or even possible in our view to separate the effects of the Fed’s balance sheet shrinkage program from other factors occurring simultaneously in the economy. Yields on the US Treasury 10-Year Note have risen substantially over the past two years; however, much of this rise occurred while the markets were absorbing the impact of the corporate tax cut, Congress’ decision to raise spending by hundreds of billions of dollars, and rising inflation expectations. Based on the timing of the yields rising, these latter events seem to have been much more important to the market than the Fed’s reduction in its buying of Treasuries and MBS. We also note that the while there is considerably more equity volatility than during the more active QE period, the main catalyst for increased equity volatility has probably not been the Fed’s balance sheet shrinkage program. Trade tensions and earnings worries have added onto concerns over rising budget deficits and increasing inflation expectations to create more equity volatility. Immediately after the September 2008 financial panic triggered by the Lehman Brothers bankruptcy and the AIG bailout; the Fed quickly lowered the effective federal funds rate to close to zero. Interestingly, at the time, the Fed seemed reluctant to target a zero rate for the effective federal funds rate, so it chose to introduce the concept of ranges and set the range at 0.00% to 0.25% at its December 2008 FOMC meeting. For the full five years 2009-2014, the effective federal funds rate averaged just 0.13%. The first-rate rise came in December 2015, then the Fed got cautious, and the next rate rise was delayed until December 2016. Since then, the Fed has been on steady pattern “of a skip an FOMC meeting, raise rates, skip a meeting, raise rates”, wash, rinse and repeat. The Fed now seems on a path to steer the effective federal funds rate to a level that is equal to or slightly higher than the prevailing rate of core inflation. This would put short-term rates more or less in “neutral” policy territory, recognizing that the definition of a “neutral” policy is not universally agreed. Pre-2008, the prevailing view was that a neutral policy embodied two components: an inflation risk premium of maybe 1% to 2% above the prevailing core inflation rate, and importantly, a modestly positively sloped yield curve with short-term rates lower than long-term bond yields. The yield curve criterion still appears to have considerable influence on Fed thinking when it comes to the question of how far to push rates, but the “neutral” inflation risk premium is now thought to be close to zero or just incrementally positive. If the FOMC membership’s collective wisdom on inflation develops as estimated, then core inflation might rise to 2.25% or 2.5%. If the FOMC’s “dot plot” is to be believed, the effective federal funds rate would peak around over 3% in 2020 after reaching 2.75%-3.00% by the end of next year. If interest rates were to peak as high as the FOMC’s non-binding forecast suggests, the yield curve could be flat or inverted by the end of the decade, depending on how long-term interest rates, which currently trade around 2.9% to 3.0% yields, respond to these and other developments in the meantime. That said, the Fed remains extremely data dependent, so if the inflation path changes, one can count on the anticipated rate path being changed as well. The current constraint on the Fed’s rate rise ambitions is the yield curve shape. Flat or inverted yield curves historically have been excellent predictors of future recessions – indicating the Fed has gone too far and pushed rates too high. It has only taken six decades of history for the Fed to wake up to this correlation. Who knows? The yield curve may not be applicable this time around, but the Fed is paying the shape of the yield curve considerable attention. [See Erik Norland’s research, “The Yield Curve - Unemployment Feedback Loop”, January 9, 2018.] The Fed only started paying interest on required and excess reserves at the end of 2008 as part of its emergency response to the 2008 panic. By paying interest on reserves at the ceiling of the new approach to setting a federal funds target range, the Fed was effectively providing a very nice income stream with no credit risk to the banking system in 2009 when it really mattered. As short-term rates have been pushed higher, the Fed has increased the interest rate it pays on required and excess reserves in lock step with increases in the federal funds target range. This works to increase the Fed’s own costs of funding its balance sheet and serves as a drag on the Fed’s earnings, most of which are paid to the US Treasury. Even with incrementally rising short-term rates and possible unrealized losses in the Fed’s portfolio of Treasuries and MBS due to falling prices (rising yields), the Fed is in no danger of losing money. Prior to 2008, the Fed typically contributed around $20 billion or a little more to the US Treasury each year. Once QE ramped-up the Fed’s balance sheet, annual contributions in the 2013-2017 period soared to the $80-$100 billion range. The Fed’s earnings are now expected to decrease modestly year-on-year as rates rise further and Treasury and MBS prices fall (yields rise). As Fed earnings decline with higher rates and a smaller portfolio, we expect the Fed to evaluate different ways of exerting influence over short-term rates to break the link between the payment of interest on reserves and decisions to encourage short-term rates to move higher or lower. This possibly means two things. First, the Fed may consider paying less interest on required and excess reserves, although not necessarily going back to the zero-rate in place before the 2008 financial panic. Second, the Fed may consider moving away from federal funds as the target for Fed interest rate policy. We will examine the two challenges for the Fed by using the federal funds rate as a target. First, maintaining the effective federal funds rate within the target range basically necessitates the Fed to pay interest on reserves at the ceiling rate to enforce the range. And second, the fed funds rate just does not trade the way it once did. Remember that Fed liabilities essentially take three forms: (1) currency in circulation ($1.5 trillion, as of April 25, 2018, which bears zero interest; (2) deposits by banks and other depositary institutions ($2.0 trillion), which includes required and excess reserves and bears interest currently at the ceiling rate of the targeted federal funds range; and (3) other items including the US Treasury deposits, liabilities to foreign official accounts, reverse repurchase agreements, etc., $700 billion), which may have slightly different funding costs depending on the nature of the liability. Before the 2008 crisis and subsequent expansion of the Fed’s balance sheet, excess reserves were much smaller. It was not uncommon for banks that had strong corporate lending franchises and weak core deposit bases to need to borrow reserves to meet their reserve requirements. Similarly, banks with a strong consumer deposit base would have an excess of reserves over their requirements, and they would lend federal funds (deposits with the Fed) to banks in need of reserves to meet their requirements. By using repurchase (repo and reverse-repo) transactions the Fed could temporarily add or withdraw reserves (fed funds) from the banking system and influence the federal funds rate – the overnight rate at which one bank lent its deposits at the Fed to another bank. Once excess reserves ballooned after 2008, few banks needed additional funds to meet their reserve requirements. And, repo transactions that added or withdrew excess reserves made little difference since the overhang of excess reserves was so large. While the Fed still does (reverse) repurchase agreements; the impact on the federal funds rate is fleeting at best. The primary means of enforcing a higher target range for the federal funds rate has been to raise the interest rate paid on reserves to the target range’s ceiling. If a depositary institution needed to borrow federal funds, they would pay a discounted interest rate or higher price for the federal funds. The result is that federal funds have tended to trade very steadily (except for the last few days of any given month) at around 10 – 15 basis points (annual rate) lower than the ceiling, which has kept the federal funds rate comfortably inside the target range. The volume of transaction, however, is generally not very high – around $75 billion a day in April 2018, for example. That is, the federal funds rate no longer trades as a truly representative rate for overnight lending. Thus, we have a joint decision process. For the Fed to make a change in how it pays interest on reserves, the Fed must also choose a new rate to target – preferably a rate that is much more representative of overnight funding costs than federal funds. Once the Fed chooses a new rate to target that de-links from federal funds, then the Fed will gain the freedom and flexibility to set a rate of payment of interest on reserves that may be lower than the new target short-term interest rate. Please note that we are likely going to see a lengthy discussion period as these ideas raise many questions. One of the additional benefits of paying a premium interest rate on reserves (that is, at the ceiling of the target rate range) is that the relatively high rate provides an incentive for banks not to expand lending. Many economists, especially those trained in the monetarist tradition have consistently worried that the massive expansion of the Fed’s balance sheet would lead to an explosive credit expansion and, in turn, a very large and undesirable rise in the rate of inflation (think 1970s). This has not happened. In addition to the rate paid on interest, banks are held to very strict capital ratio requirements, and they have not had that much room to expand credit regardless of near-zero rates and massive asset purchases by the Fed creating trillions of dollars in excess reserves. Still, if the rate paid on excess reserves was set at a “penalty” level, that is well below prevailing short-term rates, then banks would have the incentive to lend more at the higher market rates, so long as their capital ratios allowed. So, let us now move to the question of whether there are any choices for the Fed in terms of what short-term rate it targets. A bit of history is instructive. During WWII and a few years afterwards, the target was short-term Treasury bill rate, by a wartime agreement with the US Treasury and Federal Reserve. After the war had ended, President Truman wanted the rate kept low, below 1%. The Fed disagreed and there was quite a debate between the Fed and the US Treasury. The policy dispute was settled with the Accord of 1951, when the Fed won its independence from the US Treasury. The federal funds rate emerged as the target rate of choice during the 1950s, as the Fed began to use reserve requirements as an active policy tools. The Fed commenced reporting daily federal funds rates back in 1954, as part of the switch to using the federal funds rate as the primary policy rate. Even in periods when other policy actions, such as reserve requirement policies or money supply targeting, took precedent; it was the federal funds rate that came to define interest rate policy. For a short period, Fed Chair Paul Volcker initiated money supply targeting in October 1979 and abandoned it in the mid-1980s with changes in how banks and non-banks could pay interest on consumer deposits, new rules allowing brokerage accounts to pay interest, and changes in reserve accounting to a contemporaneous method (from lagged reserve accounting), all of which combined to effectively destroy the link between money supply growth and inflation. In the late 1980s, Fed Chair Alan Greenspan institutionalized setting a target for the federal funds; a range on the target rate only came into play in December 2008 as part of the decision to move rates to near-zero following the 2008 financial crisis. Just as the Treasury bill rate lost its relevance for Fed interest rate policy in the early 1950s, the federal funds rate is no longer a rate that is representative of the costs and incentives for financial institutions to expand or contract credit. The competitor rate is a newcomer – the Secured Overnight Financing Rate or SOFR. SOFR is a reference rate calculated by the New York Federal Reserve Bank based on repo rates or secured overnight funding rates. SOFR was designed as a reference rate by a committee focused on a replacement index for the US dollar London Interbank Offered Rate or LIBOR. The committee included a broad selection of financial market players from the Fed, to the Treasury, to banks, to exchanges, etc. [See: https://apps.newyorkfed.org/markets/autorates/sofr] The quantities traded overnight ranged from $750 to $850 billion during April 2018, or roughly ten times the quantity of federal funds transactions. This makes SOFR a market-based rate that is quite representative of what is happening in overnight financial markets and applicable to economic activity well beyond just depository institutions. And, the Fed has considerable experience in using repo operations to influence short-term interest rates. Will the Fed eventually choose to target some other rate than federal funds, and will it be SOFR? We do not know. We do know that there are very strong incentives in place in the post-2008, post-QE environment to consider replacing the target rate with something more representative of market conditions than federal funds. And we also believe the Fed may very well see advantages in delinking its target rate from the interest rate it sets to pay on reserves. The big disadvantage to SOFR is that we do not have much history to evaluate. The NY Fed only starting publishing SOFR every day since April 2, 2018. The back-filled history only goes back a few years and has a big gap at the end of 2017 and early 2018 which will only soon be provided. Even so, we expect the debate within the FOMC to commence very soon, although it may last a year or more. There is considerable research to be done. To paraphrase the former member of the Bank of England’s Monetary Policy Committee, Charles A. E. Goodhart, “when a central bank targets a specific metric, the nature of the metric is forever changed”. This observation in various forms is now known as Goodhart’s Law and can be viewed as a derivative of Heisenberg's uncertainty principle. It provides a cautionary message, yet our view is that change is coming for Fed targeting and for how interest is paid on reserves, and change may come sooner than one might expect, given that the debate has yet to commence. The Fed has some very interesting challenges as it seeks to craft a sustainable monetary policy that fits with the current economic environment and regulatory framework. The pieces of this puzzle need to be put together in a precise order to appreciate the interdependencies in the argument.
All examples in this report are hypothetical interpretations of situations and are used for explanation purposes only. The views in this report reflect solely those of the author(s) and not necessarily those of CME Group or its affiliated institutions. This report and the information herein should not be considered investment advice or the results of actual market experience.
|
Send this article to a friend:
 |
 |
 |

![[Most Recent Quotes from www.kitco.com]](http://www.kitconet.com/charts/metals/gold/t24_au_en_usoz_2.gif)
![[Most Recent USD from www.kitco.com]](http://www.weblinks247.com/indexes/idx24_usd_en_2.gif)
![[Most Recent Quotes from www.kitco.com]](http://www.kitconet.com/charts/metals/silver/t24_ag_en_usoz_2.gif)