
Send this article to a friend:
May
13
2019

|
Send this article to a friend: May |
|
Precious Metals Are Setting Up For A Major Rally While The Broader Markets Are Primed For A Crash
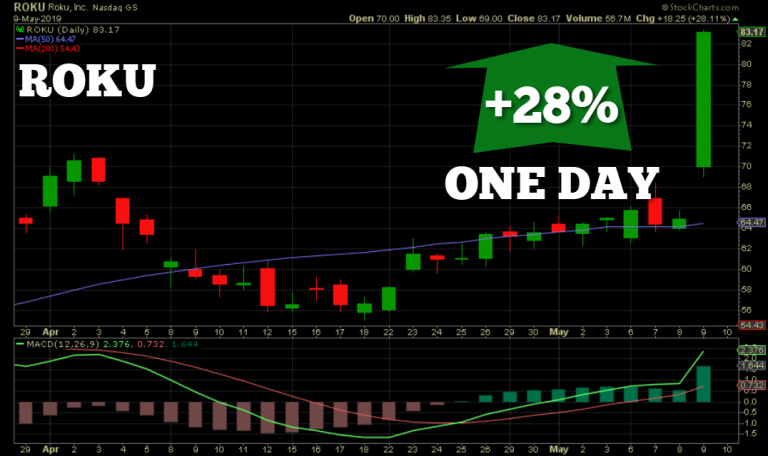
And if you don’t think the markets are getting ugly, you should see the intra-day volatile price action of some of the more well-known stocks. I continue to be amazed at the INSANE price movements taking place in the various stocks in the market. While the fundamentals haven’t played much of a role in determining the “PRICE” of stocks for a while, it seems to me that there is no rhyme or reason for the way the stocks are trading today. So, before I compare the analysis of the overall markets versus the precious metals, I wanted to provide two examples of company stock price movements over the past two days and why investors today are TOTALLY INSANE and IRRATIONAL. ROKU Stock Jumps 28% In One Day On Lousy Financials Those who aren’t familiar with the company called ROKU, they are one of the new streaming content providers to compete with Cable and Satellite. It seems as if many cable and satellite customers are growing tired of the high costs of $150-$200 a month for their TV entertainment, so they are replacing them with ROKU via YouTube TV, Hulu, Netflix, etc. On Thursday, ROKU came out with their Q1 2019 earnings, and according to several analysts, it was a BLOCKBUSTER quarter. I watched that day as ROKU started trading $5 higher before the market opened, and then shot up another $13 by the end of the day:
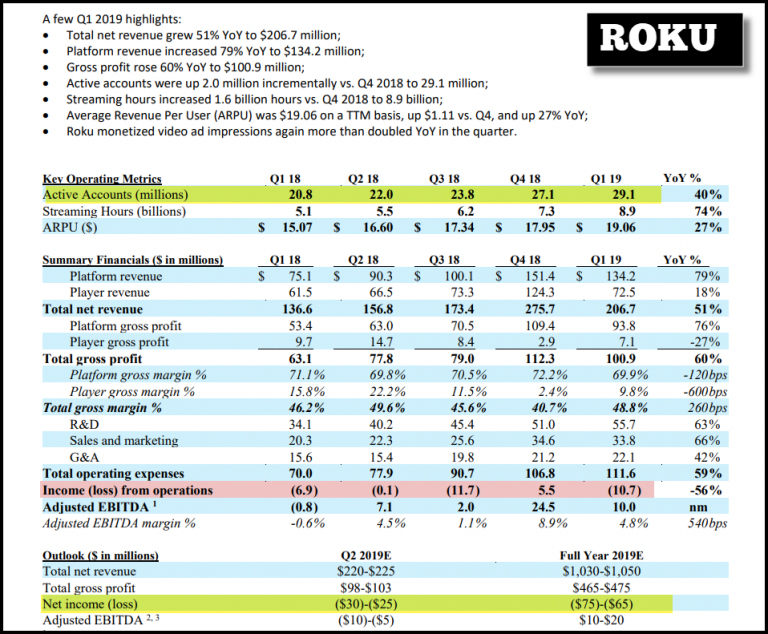
In just one day, not only did ROKU’s stock rally by more than $18, it’s market cap also increased $2.1 billion. How many stocks go up 28% in a day? Well, I don’t remember XEROX ever going up 28% in a single day in the 1980s, 1990s, or 2000s. I haven’t look at XEROX’s stock that closely, but even during the massive tech boom in the late 1990s, I didn’t see any $18 single day moves in XEROX. Regardless, some of the analysts stated that ROKU’s huge stock move that day was due to a “BLOCKBUSTER” and “FLAWLESS” quarter: Roku Soars to All-Time High on Blockbuster Earnings Roku stock soars more than 20% after ‘flawless quarter’ and big subscription opportunity As I watched in disbelief how a stock could go up 28% in one day just on earnings, I decided to read the analysts’ articles and the company’s Q1 2019 report. The first “supposed” analyst stated that ROKU’s stock jumped due to “Blockbuster Earnings.” For those who don’t read many financial reports, earnings represent the company’s profit or loss. Well, according to ROKU’s Q1 2019 financial statement, the company lost $10.7 million in the quarter, shown in the red highlighted area. However, the analysts stated that it was LESS OF A LOSS than forecasted. Really? Give me a break. Here is ROKU’s financial statement:
Then the second analyst claims that ROKU had a flawless quarter with a big subscription opportunity. The analyst is referring to the new active accounts shown at the top in the yellow highlighted area. While ROKU did indeed add another 2 million active accounts, it was less than the 3.3 million added in Q4 2018. Furthermore, if we look at the bottom of the financial table, you will see ROKU’s guidance for 2019. ROKU forecasts a loss of $25-30 million in Q2 2019 and $65-$75 million for the entire year. So, how is this GOOD NEWS?? While it is true that ROKU is adding a good bunch of new subscribers and their revenues are going up, but shouldn’t analysts care about PROFITS? Yes, I have heard plenty of times that investors realize a company can suffer losses for years before making a profit, but to see ROKU’s net income loss increase to $65-$75 million, up from the $0.6 million loss in 2018, doesn’t seem like grounds for a 28% increase in the stock price. If we take a look at the following ROKU charts, you will better understand the insanity in the stock price movement:
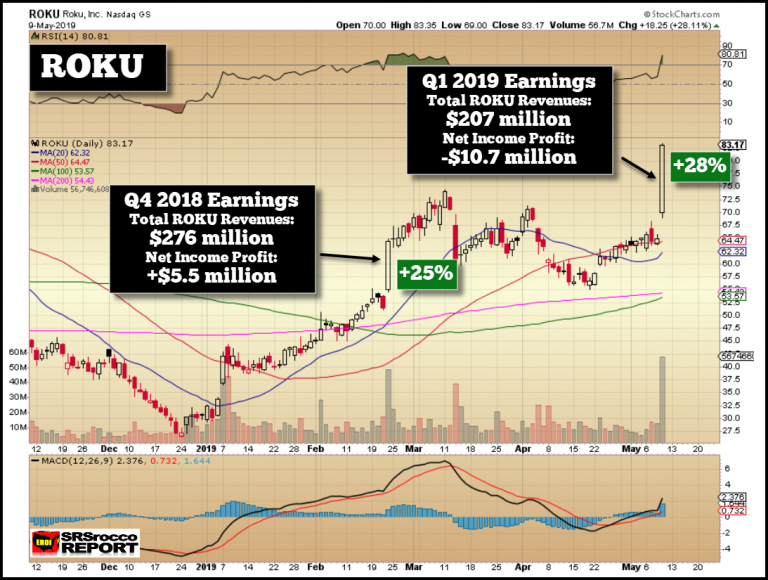
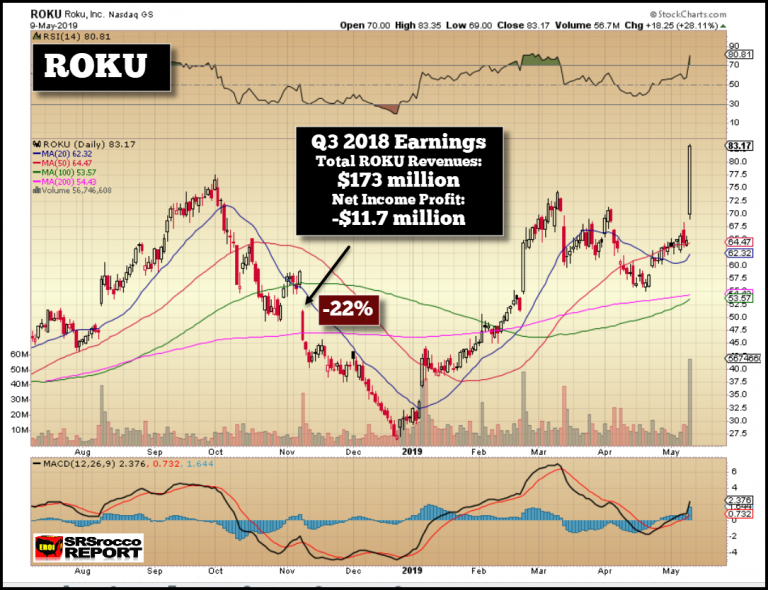
Both of the ROKU’s substantial single day stock rallies were due to their earnings release. In February, ROKU’s stock jumped $13 or 25% due to a significant increase in revenues to $276 million, with 3.3 million new subscribers and $5 million net income profit. Now, compare that to the $18 stock price jump (28%) this past Thursday due to fewer sales of $207 million, 2.0 million new subscribers and a net income loss of $10.7 million. So, how did ROKU’s stock jump even higher if its Q1 2019 financials were less remarkable than in Q4 2018? Well, to make matters even more confusing, let’s look at ROKU’s stock price action after its Q3 2018 earnings release:
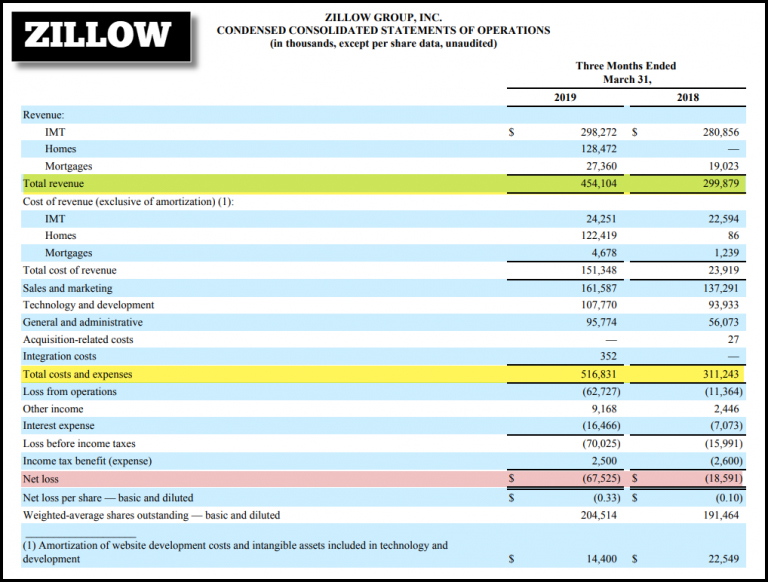
ROKU’s stock price plummeted $13 on November 8th, when it released its Q3 2018 earnings. So, with lackluster revenues of $173 million, 1.8 million new subscribers and a net income loss of $11.7 million, ROKU’s stock price fell 22% that day… LOL. How on earth did ROKU’s stock price spike 28% higher this past Thursday if its results weren’t much better than Q3 2018? Another stock that went up double digits this week on lousy earnings was the online real estate company called Zillow. After Zillow announced its Q1 2019 earnings, the stock surged 16% higher on Friday. However, at the close, it was only up 5%. Regardless, it’s amazing that Zillow’s stock price increased at all on weak earnings. Here is Zillow’s Q1 2019 Financial Statement:
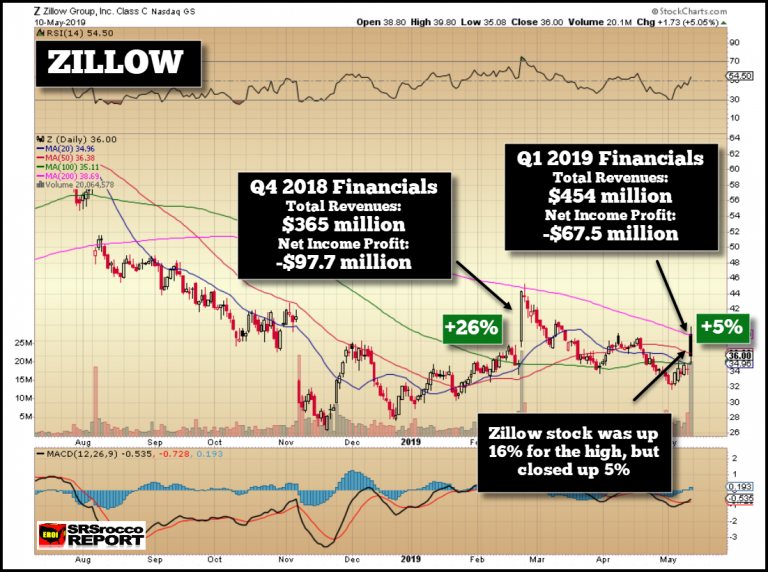
While it’s true that Zillow’s revenues increased significantly versus the same period last year, the company racked up nearly $50 million more in losses. But, Zillow’s stock price shrugged off these losses once again, because they were better than analysts expected. According to CNBC’s Diana Olick, Zillow Beats on Top and Bottom Lines: Zillow’s earnings came in at a loss of $0.33 per share on revenues of $454 million versus expectations of a loss of $0.35 a share on revenues of $433 million. Because Zillow’s losses were 2 cents less than forecasted and revenues were $19 million higher, the stock price jumped 16%. Insane, isn’t it? Furthermore, if we look at how Zillow’s Q4 2019 earnings impacted the stock price, the result is even more absurd:
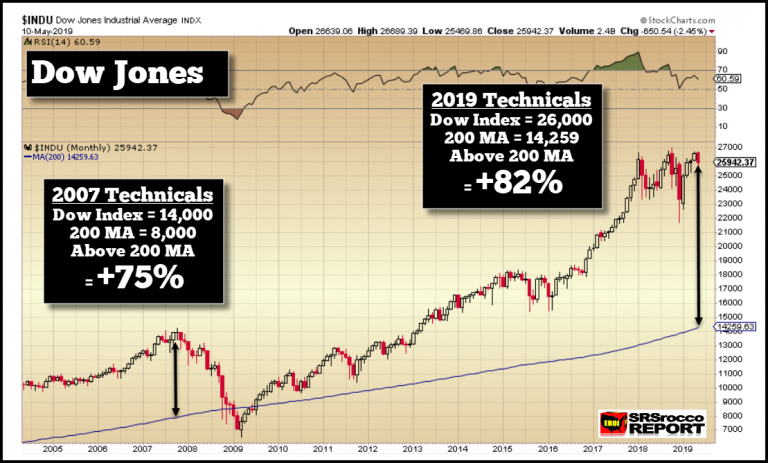
Zillow’s stock price skyrocketed 26% after reporting a $97.7 million net income loss in Q4 2018, compared to breaking even in Q3 2018. There seems to be no logic whatsoever for the stock price moves in the market today. However, analysts have trained investors to jump in or to bail out of stocks based on their ridiculous forecasts. Even though I have only focused on two stocks, the entire market is behaving the same way. Why? Well, due to central bank monetary intervention, the global stock market indexes have been pushed to 145% of GDP versus the average 65%, according to Mike Pento’s interview on USAWatchDog, which I highly recommend. So, getting back to the question… what will happen to gold and silver during the next market crash? Precious Metals Are Setting Up For A Major Rally While The Broader Markets Are Primed For A Crash To understand the dynamics of the markets, we need to look at the technical indicators. While it’s true that technical analysis can’t guarantee how the market reacts in the near term, it provides excellent indicators over the longer run. And, if we look at the technical indicators in the markets now, they are setting up for one hell of a crash. One of the best technical indicators that show whether a market (or asset) is over inflated or undervalued, is the 200 Moving Average. If we apply the 200 Moving Average (MA) to a daily chart, it’s a 200 Day moving average. If we apply it to a weekly chart, then its a 200 Week moving average and to a monthly chart, it’s a 200 Month moving average. The next series of charts will show how the 200 Month Moving Average (MMA) today compares to the peak, right before the 2008 Financial Crisis. The Dow Jones Index in 2007 (at 14,000) was 75% above its 200 MMA. Again, these charts are monthly charts, and I will be referring to the 200 Month Moving Average as 200 MMA:
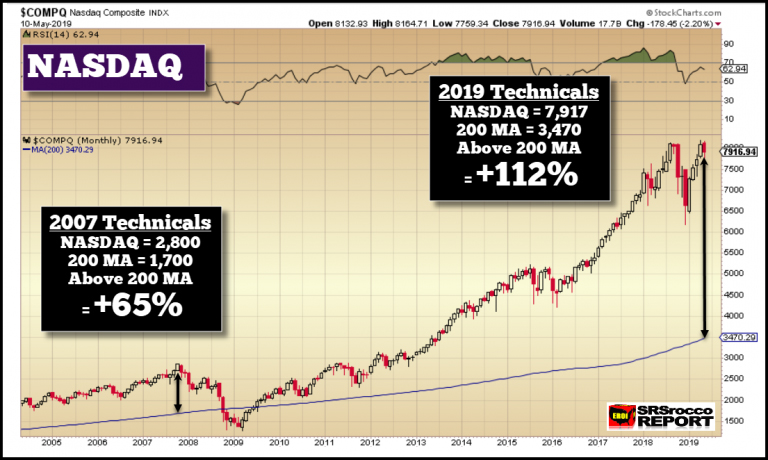
However, today, the Dow Jones is now 82% above its 200 MMA. So, we are severely overdue for a correction. All stocks and indexes eventually come back to their 200 MMA. It’s not only necessary, but it’s also healthy for the market. We cannot have rising stock values forever. Now, if we look at the NASDAQ, the technical setup is even more extreme than the Dow Jones because tech stocks today are behaving more like the mania that took place before the Great Tech Crash in 2000. The NASDAQ is currently 112% above its 200 MMA:
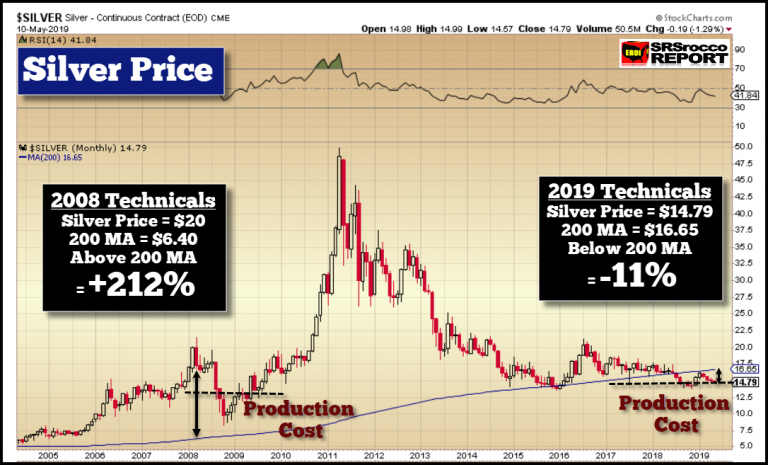
For the NASDAQ to correct back to the 200 MMA, it would have to lose more than half of its present value. As we can see, the major stock indexes today are even more inflated than they were before the 2008 financial crisis. But, that is not true for Gold and Silver. I continue to receive emails from some followers who believe gold and silver will crash along with the broader markets. While we could see a brief selloff in the precious metals, I doubt it would be anything like it was in 2008-2009. If we look at the 200 MMA for gold and silver, the technical setup presently is the exact opposite of what it was in 2008: First, let’s look at silver. In 2008, silver’s price was a staggering 212% above its 200 MMA:
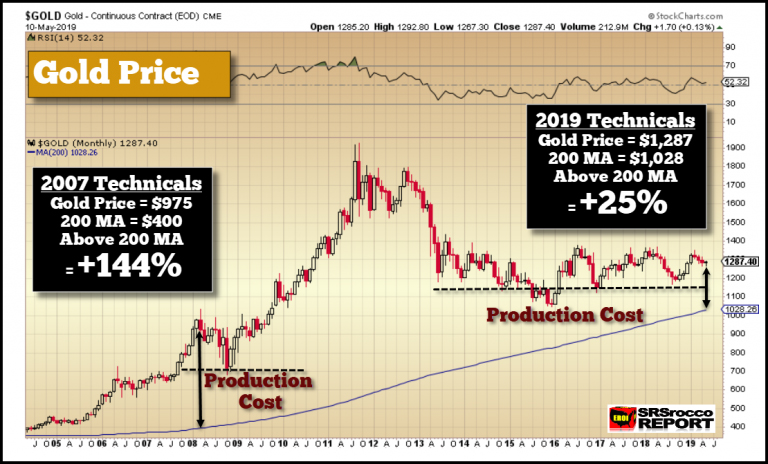
When silver was trading at $20 in 2008, its 200 MMA was $6.40. Thus, it was extremely overvalued as well as overbought. So, when the markets crashed, silver fell to the $8-$9 range. You will notice that I have included the approximate average production cost to produce silver in the two periods. Because the average annual price of oil surged higher since 2000, it impacted the cost to produce silver and gold. Thus, when the silver price fell below the production cost in 2008, it didn’t take long for it to move back above it in 2009. Today, the silver price is currently 11% BELOW its 200 MMA. While this might be a negative technical indicator for traders, I only see that as temporary — more on this in an upcoming video. According to my analysis, the current breakeven for the primary silver mining industry is about $15 an ounce. Which means, we could see lower silver prices for the short term, but we must understand, silver is not overbought or overvalued by any stretch of the imagination, quite the contrary. Also, the breakeven price to produce precious metals continues to provide a floor in the silver and gold prices. Furthermore, I had written articles and made videos showing that when the markets started to sell off, gold and silver went higher, not lower. The precious metals still act as a FEAR TRADE. Secondly, the gold price is much closer to its 200 MMA today than it was in 2008:
In 2008, the gold price was 144% above its 200 MMA versus only 25% higher today. Moreover, when the gold price corrected lower in 2008, it fell to the industry’s breakeven cost of about $650 an ounce. That was the reason it did not fall back to its 200 MMA. Also, as we can see over the past five years, the gold price has been bouncing off the $1,150 level as that is now its PRODUCTION COST FLOOR LEVEL. Yes, it’s true that gold fell below that in late 2015, but that was due to oil falling to $28 a barrel. Some analysts are suggesting that we could see gold fall back to $1,000 during the next market crash before reversing and moving to new highs. While anything is possible, I don’t see that as a “LIKELY” outcome. Due to the continued falling ore grades, even at lower oil prices, the gold mining industry’s production cost continues to increase. Of course, if we were to get rid of 75+% of global gold production, costs could fall, but that much of a reduced supply would push prices to new highs… LOL. The Major Factor To Determine Asset Values In The Future Not Considered By The Market I am just briefly going to touch on this subject matter as I want to bring this article to a conclusion. I have shown in many articles how the oil price has been the LEADING DRIVER for higher gold and silver prices. Thus, the COST OF PRODUCTION has always been the floor price for precious metals. However, at some point, we are going to see a disconnect between how the oil price (and supply) will impact the value of most assets (stocks, bonds, and real estate) versus gold and silver. Let me say this simply. The rising oil price, along with rising global oil production, has pushed up the value of most assets. However, when oil production peaks and declines, regardless of the oil price, most asset values will decline while the gold and silver prices (values) move higher. I will explain in more detail why I believe this to be true in future articles and videos. In conclusion, the stock markets are seriously over-valued if we go by their 200 Month Moving Averages. The NASDAQ and tech stocks are more overvalued than the Dow Jones Index, similar to what they were during the 1997-1999 Tech Boom. However, the gold and silver prices are at the opposite spectrum versus the overall markets as they are undervalued and closer to their 200 MMAs. Hell, the silver price is 11% below its 200 MMA. So, I believe the precious metals are setting up for one hell of a rally while the broader markets are primed for a crash. If you are new to the SRSrocco Report, please consider subscribing to my: SRSrocco Report Youtube Channel. HOW TO SUPPORT THE SRSROCCO REPORT SITE: My goal is to reach 500 PATRON SUPPORTERS. Currently, the SRSrocco Report has 155 Patrons now! Thank you very much for those who became new members and new Patrons of the SRSrocco Report site. So please consider supporting my work on Patron by clicking the image below:
Or you can go to my new Membership page by clicking the image below:
Check back for new articles and updates at the SRSrocco Report. You can also follow us on Twitter, Facebook, and Youtube below:
|
Send this article to a friend:
 |
 |
 |


![[Most Recent Quotes from www.kitco.com]](http://www.kitconet.com/charts/metals/gold/t24_au_en_usoz_2.gif)
![[Most Recent USD from www.kitco.com]](http://www.weblinks247.com/indexes/idx24_usd_en_2.gif)
![[Most Recent Quotes from www.kitco.com]](http://www.kitconet.com/charts/metals/silver/t24_ag_en_usoz_2.gif)