
Send this article to a friend:
May
12
2018

|
Send this article to a friend: May |
|
Gold To Silver Ratio Extremes
The implications are that silver will now outperform gold and that both metals will move higher as a turnaround in the ratio has bullish implications, just like it had in early 2016. At least that’s what the partial analysis of the topic would have one believe. The reality is more complex.
For instance, who would have thought that 20 years is not long enough to see the real extremes? Well, we did. Months ago. We first discussed the gold to silver ratio from the very long-term point of view and emphasized the 100 level as the key resistance in July 2017 and we provided an update on January 23rd, 2018. The key details from it remain up-to-date and seem to be worth repeating in light of the renewed popularity of the ratio between metals. The first thing that comes to mind while looking at the above chart is that the tops in the ratio usually correspond to bottoms in the precious metals market - silver tends to underperform gold to a big extent in the final part of the decline. The mid-2003 spike in the ratio doesn’t directly confirm this rule (there was a local bottom at that time, though), but the 2008 spike, 2011 bottom and the 2016 spike certainly do. So, while it is not inevitable, it seems likely that the major bottom in the precious metals will be accompanied by a big upward spike in the gold to silver ratio i.e. silver’s extreme underperformance. So far, our analysis confirms the popular one. The thing is that a move to the 80 level or so doesn’t imply that a top is in. Interpretation Of The Current Trent Let’s consider the current trend. Despite the decline in 2016, the main direction in which the ratio is heading is still up. We marked the borders of the rising trend channel with blue lines and the ratio is still closer to the lower line than the upper one – meaning that the upside potential remains intact. If the ratio is to continue to move higher (it’s likely, because an uptrend is intact as long as there is no confirmed breakdown below it), then we can expect the upper border of the trend channel to be reached (or breached – more on that in just a moment) before the top is in. If this is to be seen in the September – October timeframe, then we can expect the ratio to move to about 94 - 100. The upper border of this target area is provided by the upper border of the mentioned trend channel. The lower border of this target area is supported by Fibonacci extensions based on the 2016 bottom, 2016 top and the 2015 top. Fibonacci extensions work similarly to Fibonacci retracements – they differ, because the latter provide targets between the levels that have already been reached, while the former are usually used to provide targets outside of the previous trading range. In this case, we get 94 as an upside target. One might ask that if the above is the case, then why didn’t we draw the target area around the 94 level, but between 94 and 100 – actually even above 100. There are two good reasons for it. The first reason is visible on the above chart. Namely, history tends to repeat itself to a considerable extent, and during the previous steady uptrend (the 2008 lack-of-liquidity-driven spike was far from being steady) at the beginning of this century, the gold to silver ratio moved temporarily above the upper border of the trend channel (marked with dashed lines) and formed a top above it. Consequently, the upper border of the current rising trend channel may not stop the rally in the following months. Instead, a breakout above it might indicate that the key top in the ratio and the key bottom in the precious metals market are just around the corner. The second reason for a higher target is visible on the chart below that includes even more data than the previous one.
The tops that you saw on the previous chart appear to be the key long-term tops, but in reality, the key long-term tops are at/closer to the 100 level, while the ones from this century are not as important. Surely, they all are important long-term tops, however, we need to keep in mind that the strongest resistance will not be provided by the 2003 or 2008 tops, but by the 100 level. Implication If Gold Price Breaks Below $1,000 Moreover, please note that round numbers tend to be important support and resistance levels as they tend to attract more attention (for instance, gold breaking below $1,000 will definitely get more attention than a breakdown below $1,032) – it would be difficult to find a rounder number for the ratio to reach than the 100 level. Additionally, if the final bottom in the precious metals market was not reached in late 2015 / early 2016, because too many investors were still bullish at that time, then perhaps the extreme that the gold to silver ratio reached at that time was not extreme enough. The next resistance above the 2015 / 2016 tops is provided by the very long-term tops at or a little below 100. Consequently, it seems that predicting lower silver prices in the following months makes sense. All right, but what about the short-term chart? Wasn’t there some kind of breakdown in the ratio?
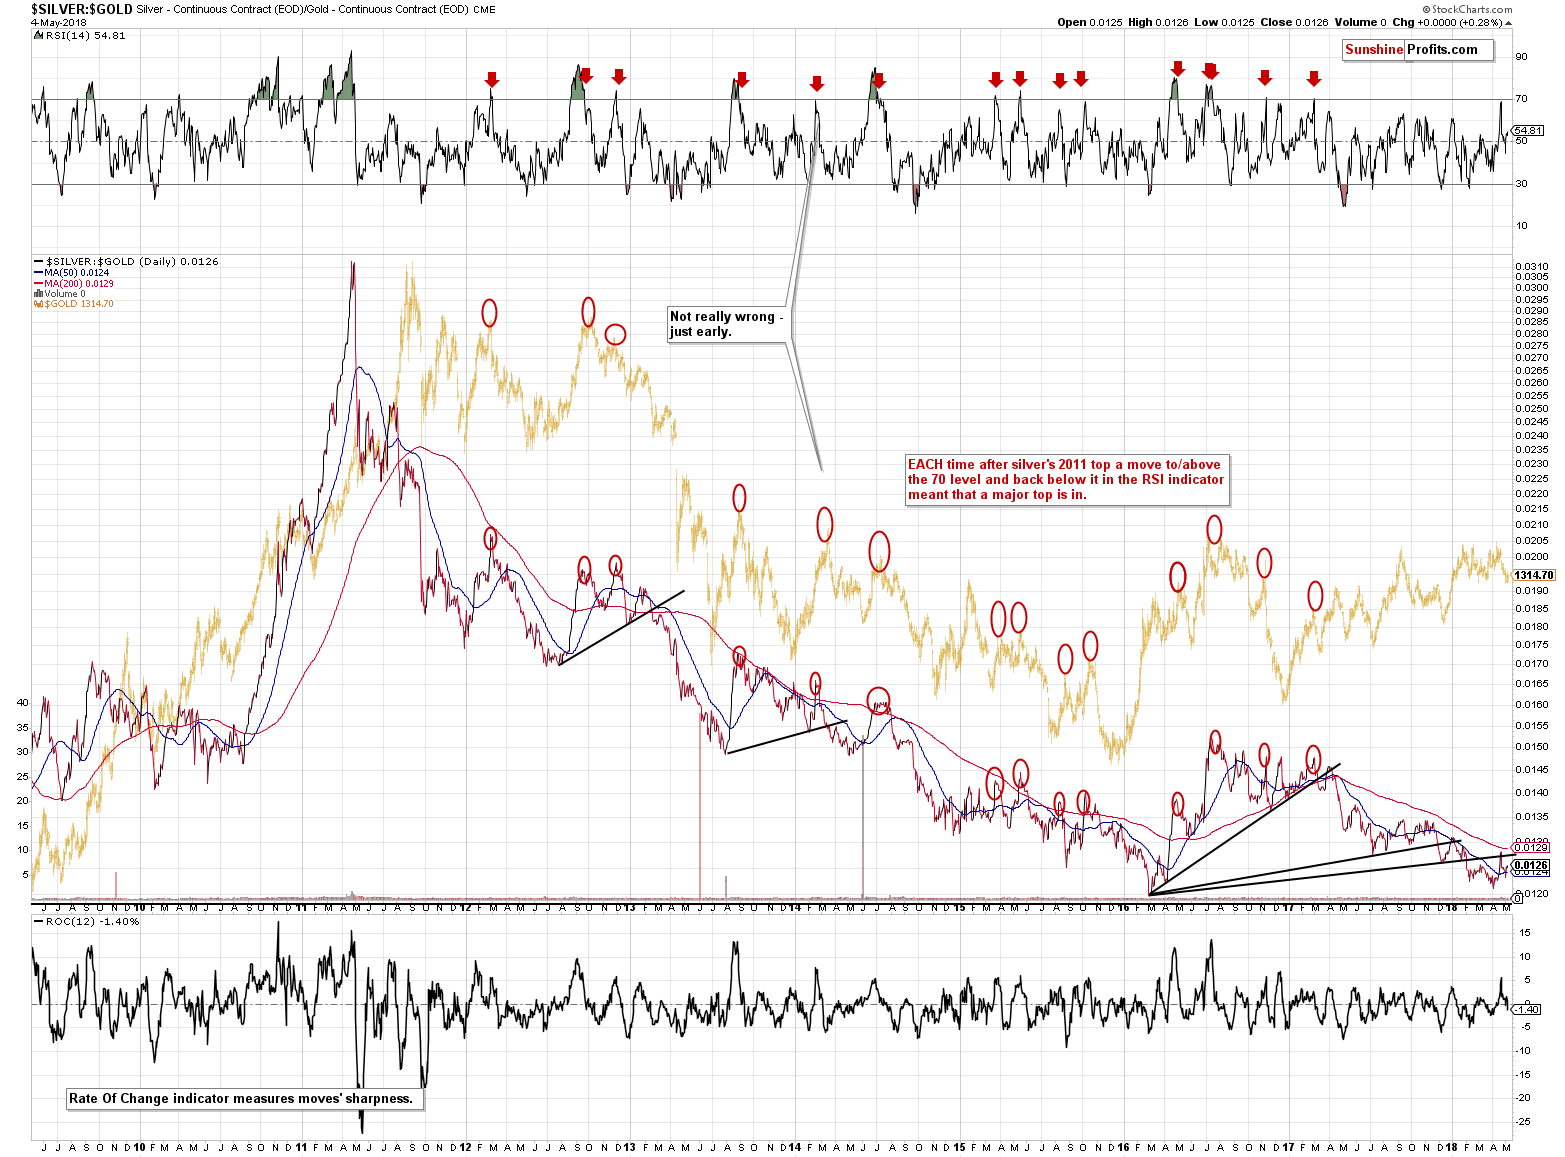
There actually was a breakdown, but not in the gold to silver ratio, but in the silver to gold ratio. The implications are exactly the opposite as one might initially think. In the April 19th, 2018 Gold & Silver Trading Alert (that’s the day when silver topped), we commented on the above chart in the following way:
The silver to gold ratio moved below its rising support line and just like it was the case in two previous cases, it moved back to this line (slightly above it) and verified it as resistance by declining once again. It seems that the next medium-term move in the silver to gold ratio will now be to the downside. This means another move higher in the gold to silver ratio. So, should one ignore everything else and wait with the purchases until the gold to silver ratio spikes to 100? Of course not. That’s just one of the tools that one can use in order to determine the optimal entry prices. On a side note, please note that we wrote “optimal” instead of “final” lows. The reason is that it is not 100% certain that a bottom is in at a specified price (it can only be certain when one looks at the past prices after a longer while), so while it may be tempting to wait for the perfect target to be reached, it might be more prudent to place the buy order above the target price to greatly increase the chance of filling it at all – however, these details go beyond the topic of this essay. When the ratio approaches its target area, all other signals will become more important – for instance gold reaching important support levels without the same action in silver or mining stocks - but with the gold to silver ratio at exactly 100 or only a bit below it and a couple other confirmations, it might be wise to invest at least partially in the entire trio (gold, silver and miners), as the confirmations would make gold’s reaching its target much more important for the entire sector than it would be without the confirmations. In other words, the gold to silver ratio serves as yet another tool in the investors’ arsenal that can help to determine whether or not the final bottom is in or at hand. It’s not a crystal ball, but one of the things one needs to keep in mind when investing capital in this promising sector. We’ll discuss other confirmations and tools in the following parts of the Preparing for THE Bottom series. What To Expect Going Forward Summing up, the gold to silver ratio moved close to previous extremes, but before assuming that this implies a reversal, one needs to consider the fact that this is not the final long-term resistance – the very long-term highs are above this decade’s highs and gold to silver ratio could move to even 100 before it reverses for good. Consequently, while this week is likely to bring higher precious metals prices, the strength is likely to be only temporary and just as the gold to silver ratio is likely to move even higher, the precious metals sector is likely to move lower in the following months. Please note that the above is based on the data that was available when this essay was published, and we might change our views on the market in the following weeks. In order to stay updated on our thoughts regarding the precious metals market and our free articles we suggest that you sign up to our gold newsletter today – it’s free and if you don’t like it, you can unsubscribe anytime. Przemyslaw Radomski, CFA Founder, Editor-in-chief, Gold & Silver Fund Manager Sunshine Profits - Gold & Silver Investment * * * * * All essays, research and information found above represent analyses and opinions of Przemyslaw Radomski, CFA and Sunshine Profits' associates only. As such, it may prove wrong and be a subject to change without notice. Opinions and analyses were based on data available to authors of respective essays at the time of writing. Although the information provided above is based on careful research and sources that are believed to be accurate, Przemyslaw Radomski, CFA and his associates do not guarantee the accuracy or thoroughness of the data or information reported. The opinions published above are neither an offer nor a recommendation to purchase or sell any securities. Mr. Radomski is not a Registered Securities Advisor. By reading Przemyslaw Radomski's, CFA reports you fully agree that he will not be held responsible or liable for any decisions you make regarding any information provided in these reports. Investing, trading and speculation in any financial markets may involve high risk of loss. Przemyslaw Radomski, CFA, Sunshine Profits' employees and affiliates as well as members of their families may have a short or long position in any securities, including those mentioned in any of the reports or essays, and may make additional purchases and/or sales of those securities without notice.
|
Send this article to a friend:
 |
 |
 |


![[Most Recent Quotes from www.kitco.com]](http://www.kitconet.com/charts/metals/gold/t24_au_en_usoz_2.gif)
![[Most Recent USD from www.kitco.com]](http://www.weblinks247.com/indexes/idx24_usd_en_2.gif)
![[Most Recent Quotes from www.kitco.com]](http://www.kitconet.com/charts/metals/silver/t24_ag_en_usoz_2.gif)