
Send this article to a friend:
April
20
2019

|
Send this article to a friend: April |
|
The S&P Index at 2900: The Biggest Wall Street/Fed Whopper Ever Told
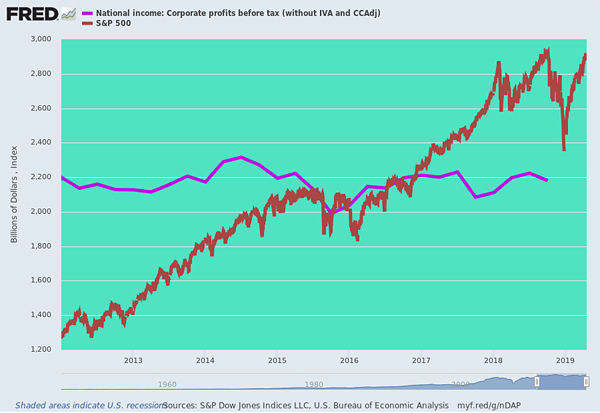
To wit, since the first quarter of 2012, the S&P 500 has risen from 1300 to 2900 or by nearly 125%. At the same time, pre-tax corporate profits of $2.20 trillion (annualized rate) in Q1 2012 have gone nowhere at all – actually posting a tad lower at $2.18 trillion in Q4 2018; and that dismal number, in turn, was down by nearly 6% from the peak $2.32 trillion level posted in Q3 2014. The chart below might give rise to the rash thought that something here is not on the up and up about the vaunted bull market. And it’s not: Those allegedly booming profits behind the soaring stock averages did not arise from the main street economy, but from one-time tax law changes, Wall Street’s ex-items accounting games, massive share buybacks and the structural shift of corporate profits to the S&P sector from smaller and unlisted companies, such as happened with the massive shift of adverting dollars and profits from traditional media companies (mostly not in the S&P 500) to Google and Facebook.
What we are saying is that the booming recovery which Wall Street and the Donald keep boasting about does not reflect gains in the broader main street economy; it’s a stock index-based simulacrum of prosperity that rests on the biggest Wall Street whopper ever told.
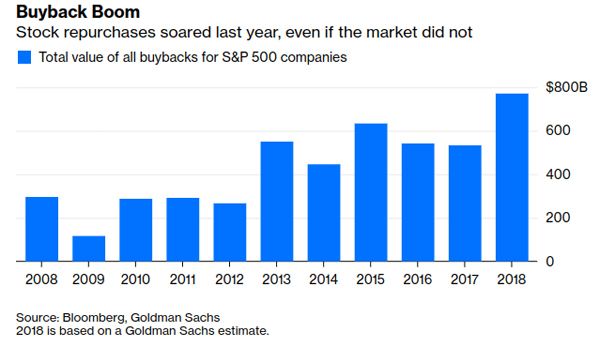
It happens that in Q1 2012, LTM reported earnings posted at $88.54 per share and represented a 14.6X PE multiple at the market’s then 1300 level. During the next six years S&P 500 reported profits rose to $132.39 per share, implying a PE multiple of 21.9X at the market’s 2900 level on the back of a 50% profit gain over the period. So on first approximation basis, increased GAAP profits account for about two-fifths of the 125% gain in the S&P 500 index – with the dominant share of the gain owing to PE multiple expansion. But that overstates the case considerably because the December 2018 LTM earnings of $132.39 were flattered by the huge one-time tailwind of the 21% corporate tax rate that was not in the numbers for any of the previous annual periods going back to 2012. In fact, about $10 per share of the $22 per share gain in 2018 was owing to the one-time tax cut effect that will have already anniversaried out of the numbers during the current quarter. So on an apples-to-apples basis for corporate tax rates – which really have little to do with production and income on main street – S&P 500 earnings for the LTM period ending in December 2018 amounted to $122 per share. This implies a 38% gain in actual pretax profits per share. Again, the relevant qualifier is “per share”. Self-evidently, the S&P 500 companies have been buying back their shares at a furious pace, and that process went full retard in response to the corporate tax cut in 2018, with nearly $800 billion of buybacks setting an all-time record. For the six-year period 2012-2018, in fact, cumulative S&P 500 buybacks totaled $3.53 trillion – a massive flow-back into Wall Street that took a big chunk out of the share float.
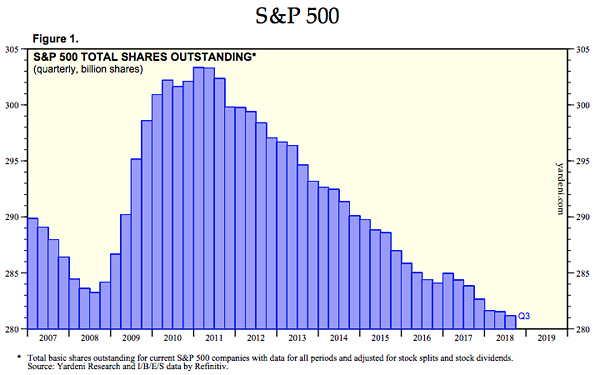
As shown below, the float of outstanding S&P 500 shares shrunk by nearly 7% between 2012 and 2018. Accordingly, on a constant share basis (2012 actual), adjusted earnings for the December 2018 LTM period would amount to just $113.75 per share. In turn, that would reduce cumulative growth over the six year period to just 28%. Stated differently, when you take the one-time tax effects and share count reductions out of the numbers, the implied apples-to-applies PE multiple at the S&P 500’s current nosebleed 2900 level computes to 25.5X. Yes, the tax cut did happen and the share counts have been sharply reduced – so the resulting earnings per share numbers are technically accurate. But a one-time tax reduction is a level change in the burden of Uncle Sam’s extractions, not permanent growth; and share count reductions have been purchased in corporate finance terms at the expense of increased balance sheet leverage risk and interest expense down the road. So earnings gains from these factors do not merit standard multiples. And most certainly not at the top of the soon-to-be longest business cycle expansion in history – a condition that says future year earnings will take a deep plunge before they again reset to the next economic expansion cycle.
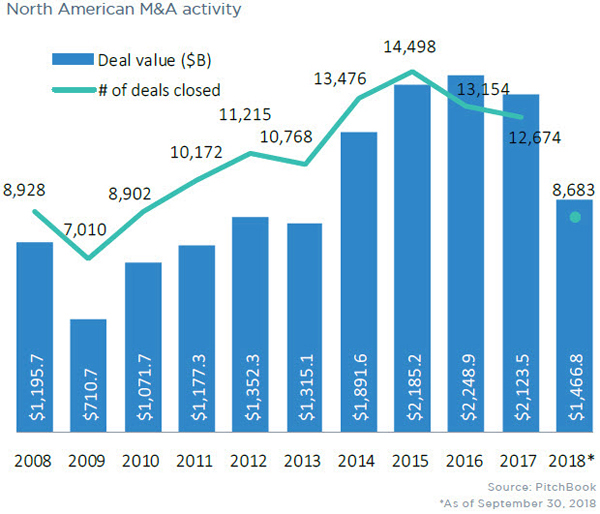
In any event, even the $113.75 per share of apple-to-apples S&P earnings for 2018 and the implied 28% growth since 2012 does not really reflect overall corporate profit gains and most certainly not macro-economic conditions on main street. That’s because certain structural changes in the US economy have had the effect of migrating corporate profits to the S&P 500 companies from the Russell 2000 and from private companies not valued on the stock exchanges at all. A big part of that is the massive M&A boom that has been fostered by the Fed’s money pumpers. As a general rule, the minnows don’t swallow the whales: That is to say, the Wall Street driven M&A machine has shifted the acquired profits of target companies into the S&P 500 index companies whenever non-S&P companies were acquired. Overall, the impact has been significant. During the period 2012-2018 nearly 85,000M&A deals with an aggregate valuation of $13 trillion were completed in North America. While it is likely that a majority of the market cap transferred in these deals was between S&P companies – still, tens of billions of annual profits were brought into the S&P index from target companies that had not been part of the index. To be sure, that migration of companies and profits to the index which wears the big boy pants involved real economics. But it was a transfer, not growth, in the aggregate economy. As such, it means that the path of main street prosperity and S&P 500 capitalization has been steadily diverging and not just since 2012, but during most of the past 30-years of Greenspan initiated monetary central planning.
Likewise, in 2012, the S&P 500 companies reported aggregate GAAP profits of about $860 billion, of which Google and Facebook combined accounted for a relatively minor $10.7 billion or just 1.2%. By contrast, during 2018 Google and Facebook posted combined profits of $53 billionwhich accounted for nearly 5% of S&P 500 profits of $1.125 trillion. More importantly, this $42 billion gain accounted for nearly 16% of the $265 billion net income gain over the past six years by all 500 companies in the index. In this instance, we are talking about M&A of a different kind. What got “acquired” by Facebook and Google was roughly $180 billion of advertising revenues that previously accrued to newspapers and magazine, billboard companies and radio and TV. Overwhelmingly, those ad revenues and the embedded profits had accrued to companies not in the S&P 500. But the crucial point is this. The total ad spend is a highly cyclical, slow-growth sector. Thus, the total ad spend in North America was $185 billion at the pre-crisis peak back in 2007 and posted at just $213 billion in 2018, thereby representing a mere 1.3% annual growth rate over the period. And that’s in nominal dollars. In real, inflation-adjusted dollars the ad spend is not really growing at all – even as a massive 40% chunk has been transferred to the big one-line ad vendors in the interim. Once again, therefore, growth in S&P profits and the index market cap is an altogether different matter than prosperity on main street, as we shall further explore in Part 2. Part 2 This bears repeating: During the 80 months between Q1 2012 and Q4 2018 the S&P index rose by 125%, but pretax corporate profits of $2.2 trillion (annual rate) did not rise by single dime. And it is the yawning gap between these two figures which dramatically underscores why main street America has flat-lined, even as Wall Street and the financial media have lost their minds in giddy flights of speculative euphoria. So doing, they have become literalistic servo-trons, which cannot see more than a few days ahead and more than one paragraph deep into the incoming financial and economic news. Again this morning, for example, they were chattering excitedly because China’s GDP – which is totally fabricated and manipulated to the decimal point by Beijing – came in at 6.4% versus an expectation of 6.3%. Are these knuckleheads trying to win the Charlie Brown award or what? We are saying this after doing a Google search for China’s first quarter GDP early this AM, but forgetting to include a date range. So what we learned from the CNBC website was this:
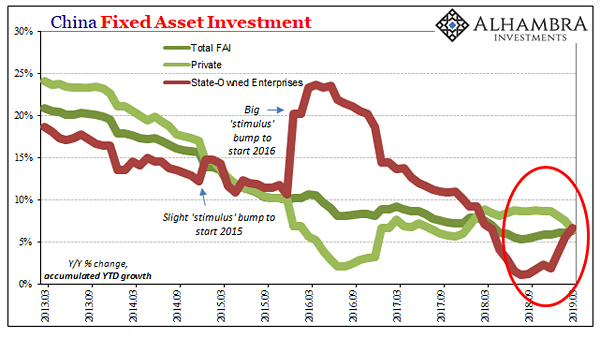
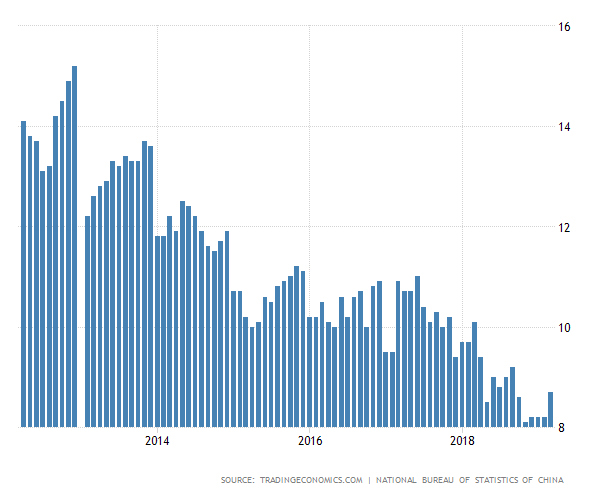
Mao must be rolling in his grave! Never could he have imagined that the capitalist press’ gullibility to propaganda would become this servile. It actually makes the Lucy and Charlie Brown football kicking gig look like an honest case of try, try again. For crying out loud, they beat by 0.1% practically every quarter. And the very fact that growth posted at exactly 6.8% three quarters in a row means that even the Red Suzerains of Beijing must have one audacious sense of humor; and one which will echo down through the ages long after the Ponzi collapses because China never, ever revises the initial data. The going philosophy at its statistical agency must be: cook it once, serve it hot and never look back! But even then they leave a trail of statistical breadcrumbs which tells you all you need to know if you don’t erase your hard drive every 24 hours. To wit, China’s credit-fueled Ponzi is relentlessly deflating and no amount of desperate 11th hour “stimulus” injections from Beijing can turn the tide. After all, is it really that hard to see that China’s $13 trillion economy is a freak of economic nature – a world historic exercise in stimulate, borrow, build, spend, speculate, rinse, repeat? What that means is the numbers being reported do not measure capitalist output in the conventional sense, where decentralized investment, production, spending and saving activities by tens of millions of private workers and businesses cumulate to national aggregates; and which are vulnerable to the bumps and grinds and occasional shocks – even before central bank interventions – which are inherent in infinitely complex marketplace networks, and which virtually guarantee growth rate volatility from one period to the next. By contrast, China’s GDP is essentially printed by the state. Beijing sets the growth targets, waterfalls them down to the local level through its party and governmental apparatus including the giant state controlled banks and industrial enterprises and then provides whatever it takes by way of new credit, bribes and sometimes punishments, too, in order to deliver the plan. On the one hand, therefore, it is not hard to understand how its GDP grows by remarkably consistent rates quarter after quarter: Approximately 17 days after each quarter’s end it essentially reports its targets and inputs of credit and stimulus as completed output for the quarter at hand. Thus, what was an input, becomes an output. It amounts to a higher form of printing press GDP. On the other hand, even more than the Keynesian GDP accounts of the western developed economies, what is being measured is not true value added and wealth creation, but merely state fostered, directed and incentivized spending on infrastructure, capital goods and consumer goods and services. But its not efficient spending because there are no market-based feedback mechanisms that cause losses, failures and cessation of unproductive spending and investments. Instead, the Red Ponzi has become a hulking giant of malinvestment – of empty malls and apartments, redundant highways, airports and trains and vastly over-capacitated industrial plant – all of which are burdened by immense unsupportable debts. At the center of that giant Ponzi is a fixed investment driver from which all other activity in China flows. For example, somebody prospers selling lunches and snacks to workers building high rise apartments that will remain empty because they were built for speculative appreciation, not occupancy (there are 60 million such units), and which could not be afforded by the overwhelming share of the Chinese population even if they were put out to let. But the lunch cart operator becomes GDP growth. As shown in the chart below – and from the Red Ponzi’s own data – the FAI (fixed asset investment) driver at the center of the Chinese economy (dark green line) was growing at more than 20% per annum as recently as 2013, but since then has steadily deflated by two-thirds to just 6.3% during the year ending in March. This is happening not only due to the law of large numbers, but because even the comrades running the great Red Ponzi understand that they are on an incendiary treadmill which requires ever larger amounts of unpayable debt to get the next increment of investment growth.
As is also evident from the chart below, the command-and-control aspect of the Red Ponzi functions in plain sight. That is to say, when the overall rate of FAI needs a temporary boost to keep the whole scheme tracking on Beijing’s GDP targets, the orders roll-out through the giant state-owned enterprises (SOEs) to goose their investment rates (red line), and that’s exactly what happened as the Chinese economy appeared to falter in 2016 and early 2017. Needless to say, that was during the run-up to the coronation of Xi Jinping as the Red Emperor for life at the 19th Party Congress in October 2017, and nothing – that is, really nothing – was left to chance. Even though Beijing clearly knew better, it cranked-up SOE investment spending to north of 20% annual rates again – even though it was already drowning in excess capacity to produce steel, aluminum, cement, solar panels, automobiles, construction machinery etc. Yet, as is also evident from the chart, as soon as a mini pre-coronation boomlet has been generated by mid-2017, Beijing threw on the brakes at the SOEs, with their investment spending growth rate tumbling to as low as 2% y/y by last September. Still, Wall Street never gets the word – mainly because it can’t stand the truth, and with every bit of vehemence as Jack Nicholson’s best imitation of Col. Nathan R. Jessup. So when Beijing cranked up the SOE red line again during the last few months the talking heads professed “surprise” that Q1 GDP beat by, well, 0.1% of a rigged approximation of China’s floundering mountain of debt and malinvestment. You can’t make this up. That Beijing was forced to resort to another artificial jolt of stimulus was actually a flashing red warning sign that it’s riding an economic tiger of its own creation, and that it is only a matter of time before Emperor XI& Co. end up in its jaws.
Needless to say, the Wall Street talking heads were out in force with the all-clear, insisting that the global growth scare was all over except the shouting; and that the Red Ponzi has bottomed and will led the world back into, well, another synchronous boom during the second half. Risk On! Actually, what the chart below says in no uncertain terms as that the Red Ponzi is actually exactly that. To the extent that it was, in fact, the driver of the planet’s central bank driven simulacrum of booming growth, the light green line tells you that the freak show is nearing its end game.
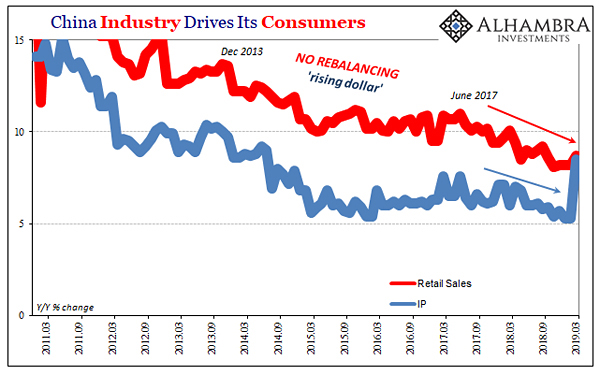
But that wasn’t the morning line of the talking heads, of course. Piled upon the bottoming signal of a 0.1% GDP beat, they espied more progress in the conversion of China’s economy to a consumption and services driven facsimile of the Keynesian central bankers’ prosperity model. Then again, it takes some serious squinting and the complete erasure of history to conclude the March’s 8.7% Y/Y gain in retail sales foretells that China is heading towards the nirvana of a land where the people shop until they drop, whether they can afford to or not. That is, the growth rate of retail sales has been steadily marching downhill for nearly eight years under a syncopated trend that occasionally blips upwards. But after virtually no year-over-year gains for four months running, the March number likely foretells only more of the same – another short-lived blip. And that’s most especially true because auto sales in March continued their unprecedented slump, dropping by 4.6% from prior year.
More importantly, China’s consumers are fast getting into hock, and still depend overwhelmingly on wages driven by the Red Ponzi’s vast industrial machine. The expansion rate of the latter, in turn, is driven by exports and FAI. Need we say more? The Donald’s Trade War isn’t going to end anytime soon – even if there is a charade of a truce by late May. The tariffs aren’t coming off for a long time to come because the upcoming deal will only give rise to endless Washington claims that China is not shedding its statist economy and thereby meeting Washington’s compliance tests. So with no export growth revival in sight and sinking under $40 trillion of debt and inexorably falling rates of FAI growth, exactly why would you think the steady decline in China’s industrial production growth rate, depicted below, would miraculously revive? Yet one thing is clear. There has been no breakout of domestic consumption growth and retail spending has not decoupled from industrial production growth at all. That is to say, the Red Ponzi is not about to save the world; it will be hard-pressed to save itself.
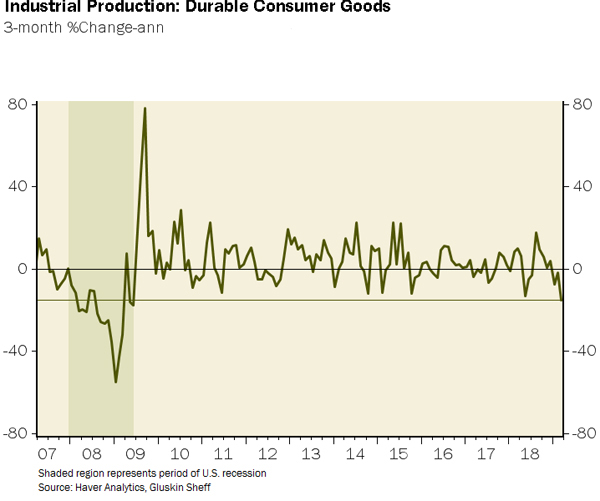
Needless to say, the evidence keeps piling up – Red Ponzi revival or no – that the Trumpian Boom was nothing more than a deficit-fueled sugar high last summer. In fact, during Q1 consumer durables production in the US virtually collapsed, falling at a 15%annual rate . As David Rosenburg noted yesterday, that takes out all the gains since 2016 and takes us back to the late stages of the 2008-09 recession. As he further noted, Shhh! Don’t tell the stock market that the recession may have already started.
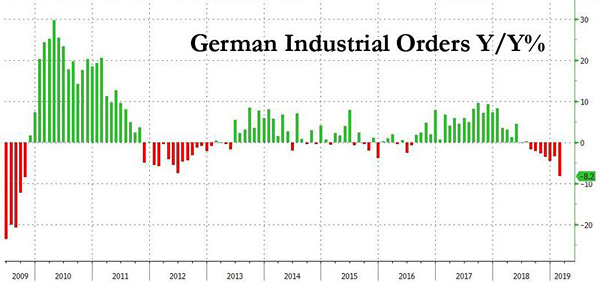
The same story is happening in Germany. Industrial orders fell by the biggest margin in more than two years in February, slumping 4.2%. That badly missed consensus expectations for a 0.3% rebound, and, instead, highlights the extent of the slowdown amid the Donald’s ongoing global trade wars, which are headed for Europe next. On an annual basis, the collapse was almost unprecedented, with the 8.2% drop matching the worst since the global financial crisis.
Yet the talking head see none of this and for a good reason: They have been so house-trained by the notion that when all else fails, the state will step in with another dose of “stimulus” that they can’t imagine the possibility that governments and their central banking branches all over the world are effectively out of dry powder. As we will see in Part 3, they most definitely are. Reprinted with permission from David Stockman’s Contra Corner.
|
Send this article to a friend:
 |
 |
 |


![[Most Recent Quotes from www.kitco.com]](http://www.kitconet.com/charts/metals/gold/t24_au_en_usoz_2.gif)
![[Most Recent USD from www.kitco.com]](http://www.weblinks247.com/indexes/idx24_usd_en_2.gif)
![[Most Recent Quotes from www.kitco.com]](http://www.kitconet.com/charts/metals/silver/t24_ag_en_usoz_2.gif)