
Send this article to a friend:
February
02
2018

|
Send this article to a friend: February |
|
Fed’s QE Unwind Accelerates Sharply
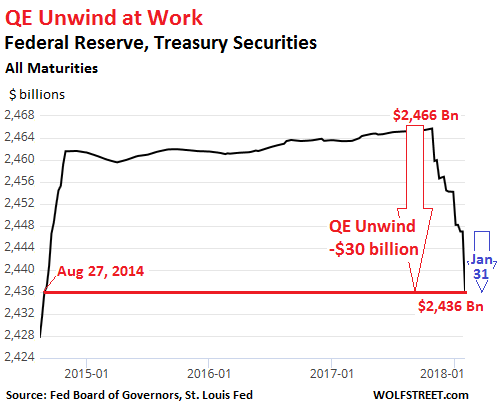
The Fed’s balance sheet for the week ending January 31, released this afternoon, completes the fourth month of QE-unwind. And it’s starting to be a doozie. This “balance sheet normalization” impacts two types of assets: Treasury securities and mortgage backed securities (MBS) that the Fed acquired during the years of QE and maintained afterwards. The Fed’s plan, as announced in September, is to shrink the balances of Treasuries and MBS by up to $10 billion per month in October, November, and December 2017, then to accelerate the pace every three months. In January, February, and March 2018, the unwind would be capped at $20 billion a month; in Q2, at $30 billion a month; in Q3, at $40 billion a month; and starting in Q4, at $50 billion a month. According to this plan, balances of Treasuries and MBS will shrink by $420 billion in 2018, by an additional $600 billion in 2019, and by an additional $600 billion every year going forward until the Fed deems the level of its holdings “normal.” Whatever this level may turn out to be, it will be much higher than the level suggested by the growth trajectory before the Financial Crisis. For January, the plan called for shedding up to $20 billion: $12 billion in Treasuries and $8 billion in MBS. So how did it go? On its December 27 balance sheet, the Fed had $2,454 billion of Treasuries. By January 31, it had $2,436 billion: a drop of $18 billion in one month! This exceeds the planned drop of $12 billion for January. But hey, over the holidays, most folks at the New York Fed, which does the balance sheet operations, were probably off and not much happened. And so this may have been a catch-up action, with a sense of urgency. In total, since the beginning of the QE Unwind, the balance of Treasuries has plunged by $30 billion, to hit the lowest since August 27, 2014. This part of the QE Unwind is happening:
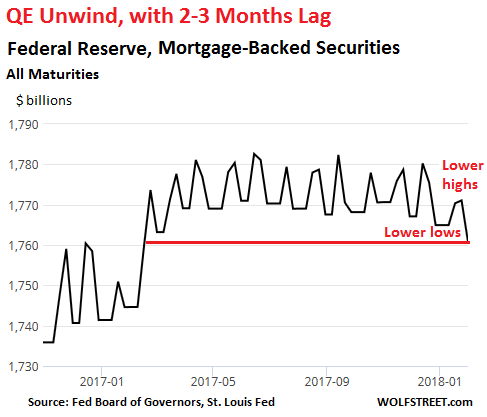
The jagged down movement in the chart is a result of the way the Fed unwinds its QE. It does not sell the securities. It allows them to “roll off” its balance sheet. It works this way: Treasuries mature in mid-month and at the end of the month. For example, on January 31, about $27 billion of the Fed’s Treasuries matured. The Treasury Department redeemed those securities (normal bondholders would be paid face value). But the Fed has a special arrangement with the Treasury Department that cuts out the middlemen. To maintain the level of Treasuries, the Fed would “roll over” these securities directly with the Treasury Department – replacing maturing securities with new securities. But under the QE unwind, the Fed allows part of those securities to “roll off” rather than allowing them to “roll over.” In other words, the Fed does not replace some of the maturing securities and instead gets paid for them. Of the $27 billion in Treasuries that matured yesterday, the Fed “rolled over” $16 billion (replaced them) and allowed $11 billion to “roll off” (got paid for them). The blue arrow in the chart above shows this big one-day move. MBS: a jagged line and a lag of two to three months. The Fed acquired residential MBS guaranteed by Fannie Mae, Freddie Mac, and Ginnie Mae as part of QE. Now, it’s supposed to shed them at a pace of $4 billion a month in Q4 last year and $8 billion a month in Q1 this year. So how did it go? Residential MBS differ from regular bonds. The issuer (Fannie Mae et al.) passes through principal payments to MBS holders as underlying mortgages get paid down or get paid off. Thus, the principal shrinks in uneven increments until the remainder is redeemed at maturity. To keep the MBS balance steady, the New York Fed’s Open Market Operations (OMO) buys MBS in the “to-be-announced market” (TBA market). The actual MBS is not designated at the time of the trade but will be announced 48 hours before the established settlement date, which can be two to three months later. The Fed accounts for its MBS on a settlement-date basis. So there is a mismatch between the date the Fed receives principal payments and the date reinvestment trades settle. Hence the jagged line in the chart below. Since MBS take two to three months to settle, the first declines weren’t expected to show up on the Fed’s balance sheet until sometime December. But since MBS balances have large weekly variations due to the timing issues, those early declines were hard to see. This is why we look for “lower highs” and “lower lows” with a lag of two to three months, which is what we see in January, a reflection of trades that took place around November:
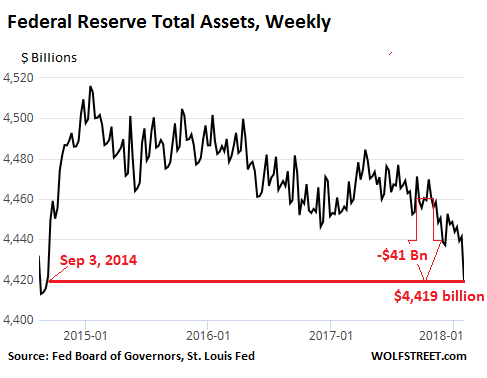
At the end of October, before the MBS Unwind became visible, the Fed held $1,770.2 billion in MBS, at the low point of the period. On today’s balance sheet, also the low point in the chart, the Fed shows $1,760.7 billion. From low to low, the balance dropped $9.5 billion. This reflects trades from two to three months ago. So even the MBS Unwind is now clearly visible. In early December, I published my article with the above explanations about why we hadn’t yet seen the MBS Unwind. About a month later, the NY Fed published its own article, confirming my explanations, including the reasons behind the jagged line and that MBS take two to three months to settle. So why all this noise in the overall balance sheet? Total assets have dropped by $41 billion since the QE Unwind began, the lowest since September 3, 2014:
But why all this noise in the chart? The Fed has other roles that cause assets and liabilities to fluctuate. Among them: it is the official banker of the US government. The US Treasury keeps its cash balances on deposit at the Fed (rather than JP Morgan). When the balance fluctuates, is causes the Fed’s assets and liabilities to fluctuate, as they would with any bank. Similarly, the Fed holds “Foreign Official Deposits” by other central banks and governments. And the Fed has other functions that impact the overall balance sheet (explained here). But movements caused by these functions have nothing to do with QE or with the QE Unwind. For the QE Unwind, only Treasuries and MBS matter. And the Fed is shedding them — after everyone had said for years that it could nevershed them. The Treasury market may be finally paying attention: The 10-year yield closed today at 2.78%, the highest since April 2014. Just as the Fed accelerates its QE Unwind, and as Treasuries react, the government is planning to sell a massive pile of new debt. Read… US National Debt Will Jump by $617 Billion in 5 Months Would you like to be notified via email when WOLF STREET publishes a new article? Sign up here.
|
Send this article to a friend:
 |
 |
 |


![[Most Recent Quotes from www.kitco.com]](http://www.kitconet.com/charts/metals/gold/t24_au_en_usoz_2.gif)
![[Most Recent USD from www.kitco.com]](http://www.weblinks247.com/indexes/idx24_usd_en_2.gif)
![[Most Recent Quotes from www.kitco.com]](http://www.kitconet.com/charts/metals/silver/t24_ag_en_usoz_2.gif)