
Send this article to a friend:
February
14
2017

|
Send this article to a friend: February |
|
Golden Cross: The Last Time THIS Happened, Gold Prices Ran From $290 To All-Time High Of $1923!
This indicator has just broken upwards again… A Golden Cross is a bullish breakout pattern normally of the 50 period MA in relation to the 200 period MA. There has been plenty of interest in my recent chart showing this happening in Weekly Gold. To re-cap, we have only seen the 50 Week cross the 200 Week four times in the last twenty-five years and, according to Ned Naylor-Leyland, this was, “predictive of 3-10 years of subsequent market direction”. The previous time that the 50 Week MA broke UPWARDS in Gold was in 2002 and price then ran from $290 to the all-time high of $1923. This indicator has just broken upwards again…..
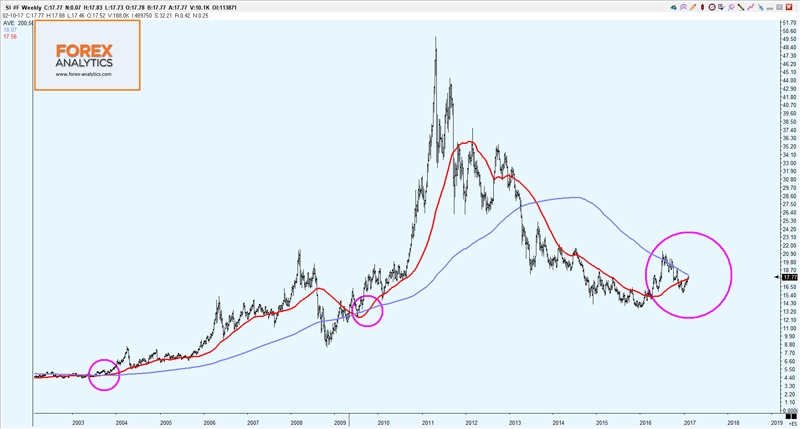
Typically with Silver it has not been so clear cut – in fact the Moving Averages have yet to cross – it looks as though it won’t be long before they do as the 50 Week is at 17.56 and rising whereas the 200 Week is at 18.07 and falling.
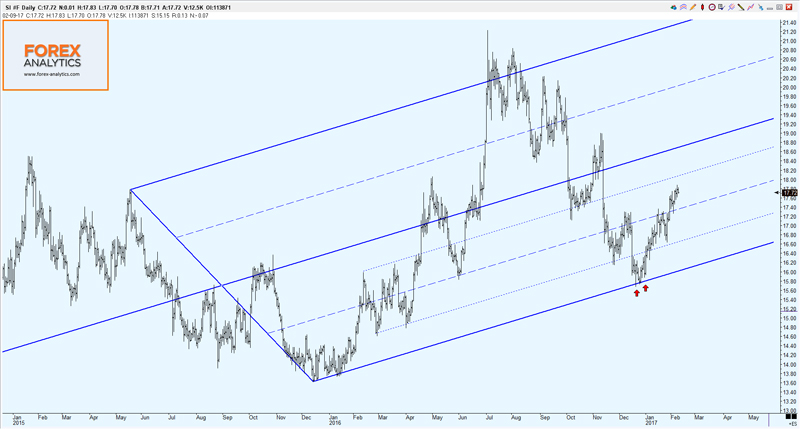
In the last fifteen years we have seen two upwards Golden Crosses – in 2003 price ran from $4.70 to $21.44 and in 2009 it went from $17.80 to the all-time high of $49.82. That’s potentially big news, but these are really long term indicators – it’s great for stackers and traders that price looks to be moving into a sustained uptrend, but what’s happening in the medium to shorter term? At Forex Analytics we look to provide clear and uncluttered charts, using Median Lines (Pitchforks) to identify High Probability, Low Risk entries and exits for traders and investors. For example, the recent fall in the price of Silver hit a low of $15.46 – we had followed it down using 60 minute and 240 minute charts until it reached the Lower Parallel of the Daily Pitchfork shown in the Chart below:
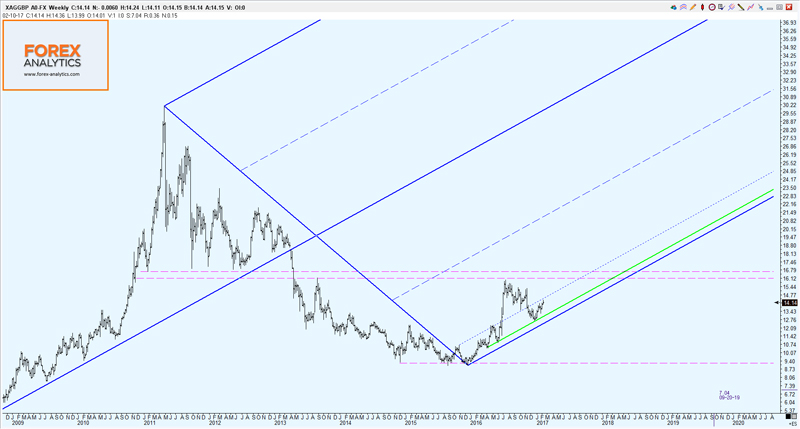
It was not a surprise to see price rebound strongly from there and we touched a recent high of $17.88. It’s all too easy to only think of Silver in US Dollar terms. We monitor it across currencies – take a step back and look at the enormous potential upside when pricing it in GBP, CAD or JPY. Chart 4 is Silver in British Pounds on a Weekly basis and the Pitchfork not only shows a significant line of support but also the potential for price to run much, much higher.
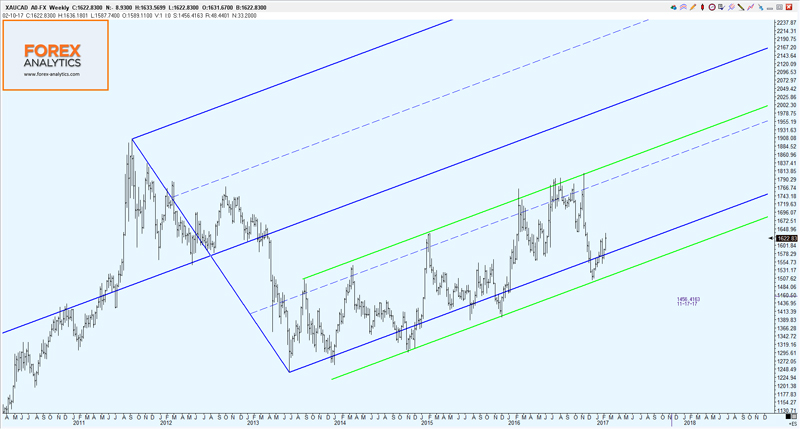
Chart 5 is Silver in Canadian Dollars and once again the Pitchfork delineates lines of Support and Resistance – the green Sliding Parallel above is at about C$29.
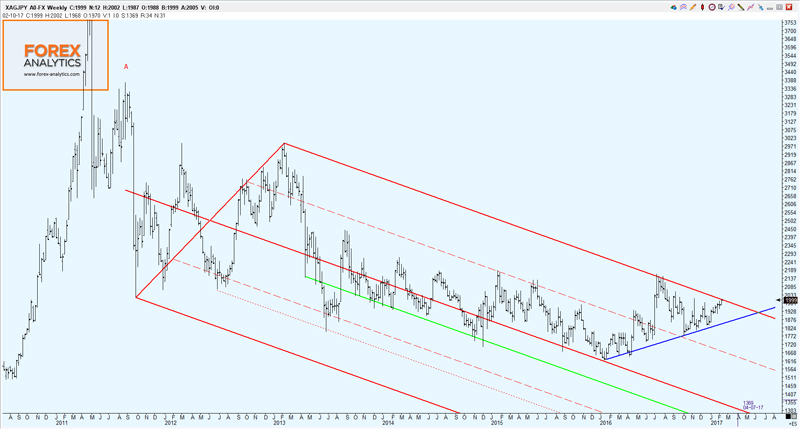
Chart 6 shows Silver in Japanese Yen at long term Resistance – a solid break through the 2000 level could presage a strong move.
There is certainly the opportunity for significant upside in Silver across a number of currencies. Is the approaching Golden Cross in US dollars the lighting of the blue touchpaper before we see some serious fireworks? Forex Analytics provides Premium Technical Analysis of Precious Metals, Currencies Commodities and Indices at www.forex-analytics.com or email [email protected]
|
Send this article to a friend:
 |
 |
 |
 The previous time that the 50 Week MA broke UPWARDS in Gold was in 2002
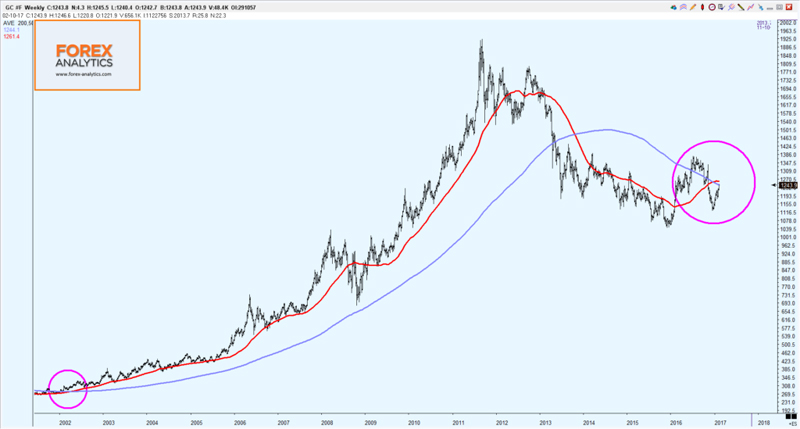
![[Most Recent Quotes from www.kitco.com]](http://www.kitconet.com/charts/metals/gold/t24_au_en_usoz_2.gif)
![[Most Recent USD from www.kitco.com]](http://www.weblinks247.com/indexes/idx24_usd_en_2.gif)
![[Most Recent Quotes from www.kitco.com]](http://www.kitconet.com/charts/metals/silver/t24_ag_en_usoz_2.gif)