
Send this article to a friend:
January
02
2020

|
Send this article to a friend: January |
|
Gold Surges Due To Troubled Fed Repo & U.S. Treasury Market
Many reasons have been attributed to the break-down in the U.S. Repo Market that started on September 17th when the daily repo rate spiked to 10%. Several readers have sent me very interesting information and youtube videos on the subject matter. I thought it was a good time to sift through all the information and present my analysis on what the hell I believe is going on. First and foremost, while there are many reasons given for why the Fed Repo rate spiked, forcing the Fed to provide hundreds of billions of dollars of short-term liquidity in the market, these are “ALL SUPERFICIAL” reasons. The major factors causing wide-spread havoc throughout the financial system are the Falling EROI- Energy Returned On Investment of oil and the Thermodynamics of oil depletion. While these are two different energy analyses, they come to the same conclusion. The financial analyst community and market are still ignoring these key energy factors. Second, the main “SUPERFICIAL” reason that caused the Fed Repo rate to spike is that there weren’t enough buyers for the increasing amount of U.S. Treasury issuance. I will explain the details in a minute. However, one of my main long-time followers and supporters of the SRSroccoReport site sent me a fascinating video on Deutsche Bank and how it is likely the cause of the present problems in the Fed Repo market. This may also be true. But, even though there may be trouble at Deutsche Bank, it doesn’t account for the even bigger problem… FUNDING the U.S. Government Debt that has once again exploded higher.
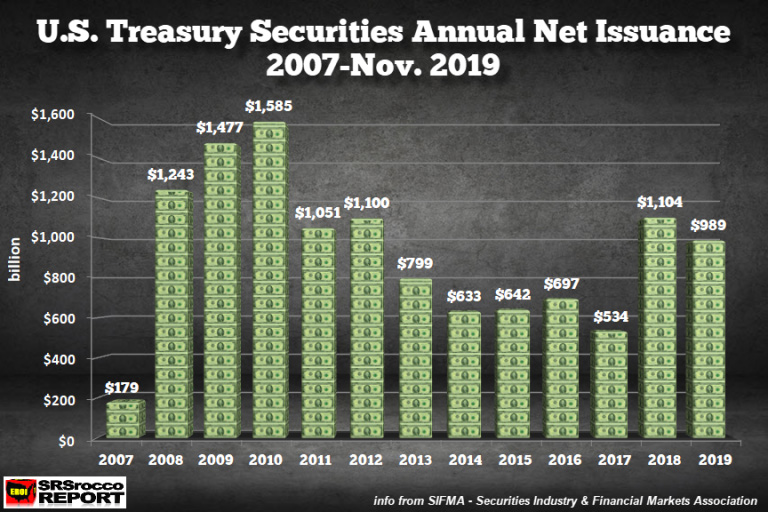
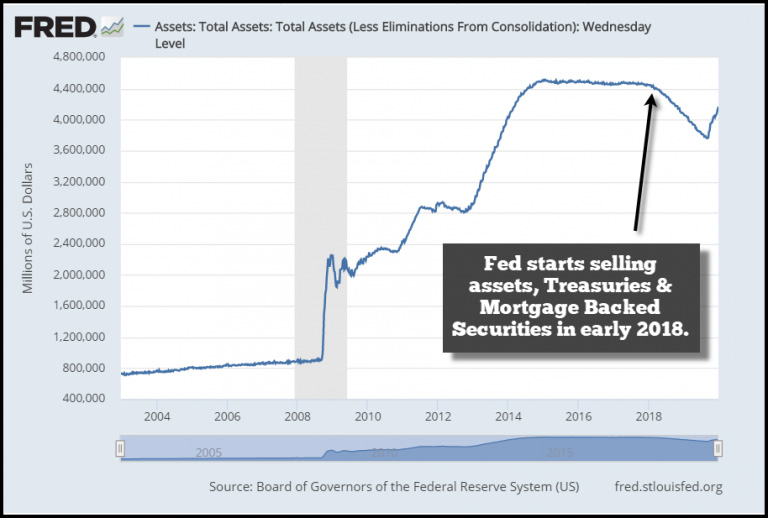
After the 2008-2009 financial crisis, U.S. Government deficits ballooned, forcing the “Net Issuance” of more U.S. Treasuries. In the chart above, the net issuance of U.S. Treasuries spiked to $1,585 billion ($1.58 trillion) in 2010. However, after the economy started to recover, the net issuance of U.S. Treasuries continued to decline to only $534 billion in 2017. But, the very next year, in 2018, something changed as the U.S. Treasury net issuance surged to $1,104 billion. This was bad news… but why? We have to remember that the Fed started reducing its balance sheet by selling U.S. Treasuries and Mortgage-Backed Securities into the market in early 2018:
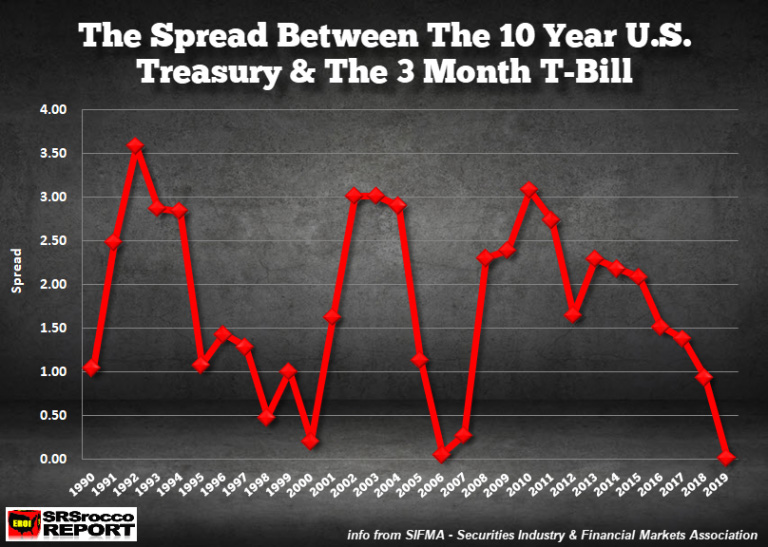
So, get this… the Fed was a net seller of U.S. Treasuries and Mortgage-Backed Securities in 2018 right at the very same time, the U.S. Government’s net issuance of U.S. Treasuries doubled from $534 billion in 2017 to $1,104 billion in 2018. This had a profound impact on the U.S. Treasury rates, especially the 10 Year/3 Month Spread. Now, to make this easy to understand, the 10-Year/3 Month Treasury rate spread shows how much more demand there is for either the shorter-term Treasuries or the longer-dated ones. If the 10-Year/3 Month spread falls, then there is more demand for the 10 year Treasury, which suggests investors are worried about an upcoming recession. The 10-Year/3 Month U.S. Treasury spread has been steadily falling since 2010 and is now only 0.02 compared to 3.08 in 2010:
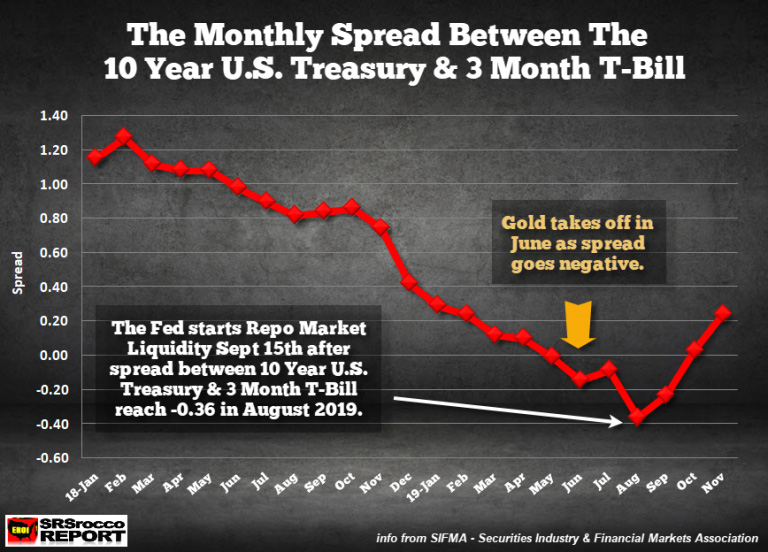
According to SIMFA, the Securities Industry & Financial Markets Association, the average rate for the 10 Year U.S. Treasury (Jan-Nov) was 2.17 versus 2.15 for the 3 Month Treasury Bill. Thus, there is a positive 0.02 Spread. However, there were some real problems starting in June when the 10-Year/3 Month Treasury spread went NEGATIVE:
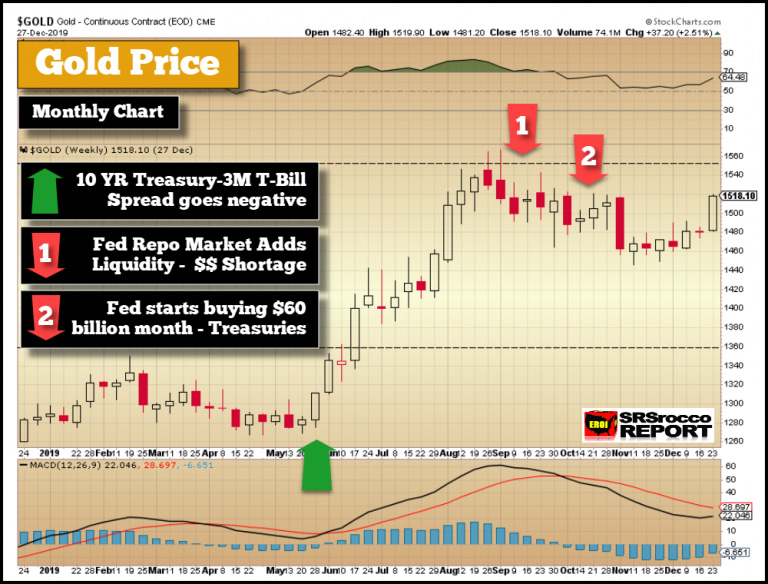
There is no coincidence that the Gold Price began to take off in June 2019 when the 10-Year/3 Month Treasury spread went negative… for the first time since the 2007 financial crisis began. As the 10-Year/3 Month, Treasury spread went further negative until August, the gold price continued higher to reach a peak of $1,560 at the end of the month. Then what happened in September and October?? You got it, the Fed came in and started the Repo Operations in mid-September and then announced the $60 billion a month in U.S. Treasury purchases in mid-October:
The GREEN arrow shows where the 10-Year/3 Month Treasury spread started to go negative, and over the next three months, as the spread reached a low of -0.36 in August, the gold price increased $300. The RED arrows show that when the Fed came in to save the day in September with its Repo Market operations, providing short-term liquidity, and then again in October to buy $60 billion a month, the 10-Year/3 Month spread moved higher.
With the global economy stalling and some regions heading into a recession, there are fewer surpluses available to be able to buy the increasing amount of U.S. Treasuries, not including the amount that is continuously rolled over. Another video sent to me from the same long-term reader shows that the U.S. Government has to issue another $6 trillion in “Gross” Treasuries over the next six months. I agree with the analysis presented in the video by Luke Gromen: Even though there may be a BIG PROBLEMS with individual banks that caused the Fed Repo rate to spike on September 17th, shown in the video above on Deutsche Bank, the main issue is that the U.S. Government is issuing more Treasuries than the market can absorb. Thus, the Fed had to start buying U.S. Treasuries, which helped push the 10-Year/3 Month spread back into positive territory. However, the problem isn’t over as the market mistaken assumes… IT’S JUST BEGINNING. I believe the September 17th Fedo Repo rate spike to 10% was the CRISIS and will only get worse as time goes by. The Thermodynamics of Oil Depletion is destroying the Net Energy available to the market to generate Real Economic Growth. As Economic growth stalls, there are fewer surpluses to purchase the $1+ trillion a year in new net U.S. Treasury issuance. Thus, the Fed is now monetizing our deficits. This is all VERY GOOD news for Gold and Silver. The U.S. and World enjoyed a 10 Year Reprieve after the 2008-2009 financial crisis, and that was mostly due to the ramping up of U.S. Shale Oil Production. Without the additional 7.5 million barrels per day of U.S. Shale oil over the past decade (accounting for 75% of global oil production growth), the system would have collapsed years ago. Keep an eye on the U.S. Shale Oil Industry as it is the canary in the coal mine. I believe we are going to start seeing fireworks this year in the U.S. Shale Oil Industry and it will only get worse as time goes by. If you are new to the SRSrocco Report, please consider subscribing to my: SRSrocco Report Youtube Channel. HOW TO SUPPORT THE SRSROCCO REPORT SITE: My goal is to reach 500 PATRON SUPPORTERS. Currently, the SRSrocco Report has 155 Patrons now! Thank you very much for those who became new members and new Patrons of the SRSrocco Report site. So please consider supporting my work on Patron by clicking the image below:
Or you can go to my new Membership page by clicking the image below:
Check back for new articles and updates at the SRSrocco Report. You can also follow us on Twitter, Facebook, and Youtube below:
|
Send this article to a friend:
 |
 |
 |


![[Most Recent Quotes from www.kitco.com]](http://www.kitconet.com/images/live/s_gold.gif)
![[Most Recent USD from www.kitco.com]](http://www.weblinks247.com/indexes/idx24_usd_en_2.gif)
![[Most Recent Quotes from www.kitco.com]](http://www.kitconet.com/images/live/s_silv.gif)