
Send this article to a friend:
January
17
2018

|
Send this article to a friend: January |
|
Is It True? Do Low Rates Justify High Valuations
A related mainstream truth is rising rates will cause high stock market valuations to fall. In fact, recently, both Bill Gross and Jeffrey Gundlach have commented on the level of 10-year Treasury rates and why they are destined to go higher. Gundlach even went further, suggesting that if 10-year rates were to rise above 2.63% (currently 2.55%), stock prices would begin to fall. While Gundlach possesses a sterling track record, and his comment captures a prominent fear among investors, his comment also seems to define the term “spurious precision.” Can it be true that stocks are a safe investment at 2.62% but not 2.63%? Are the two “truths” in bold above supported by the historical record? Believe it or not, the answer is no, as we will explain. Let’s begin by examining stock market valuations. Most professional observers of financial markets would agree that stocks valuations are high compared to their historical range. This fact is demonstrated in the chart of the Shiller CAPE ratio (Cyclically-Adjusted PE ratio) below.
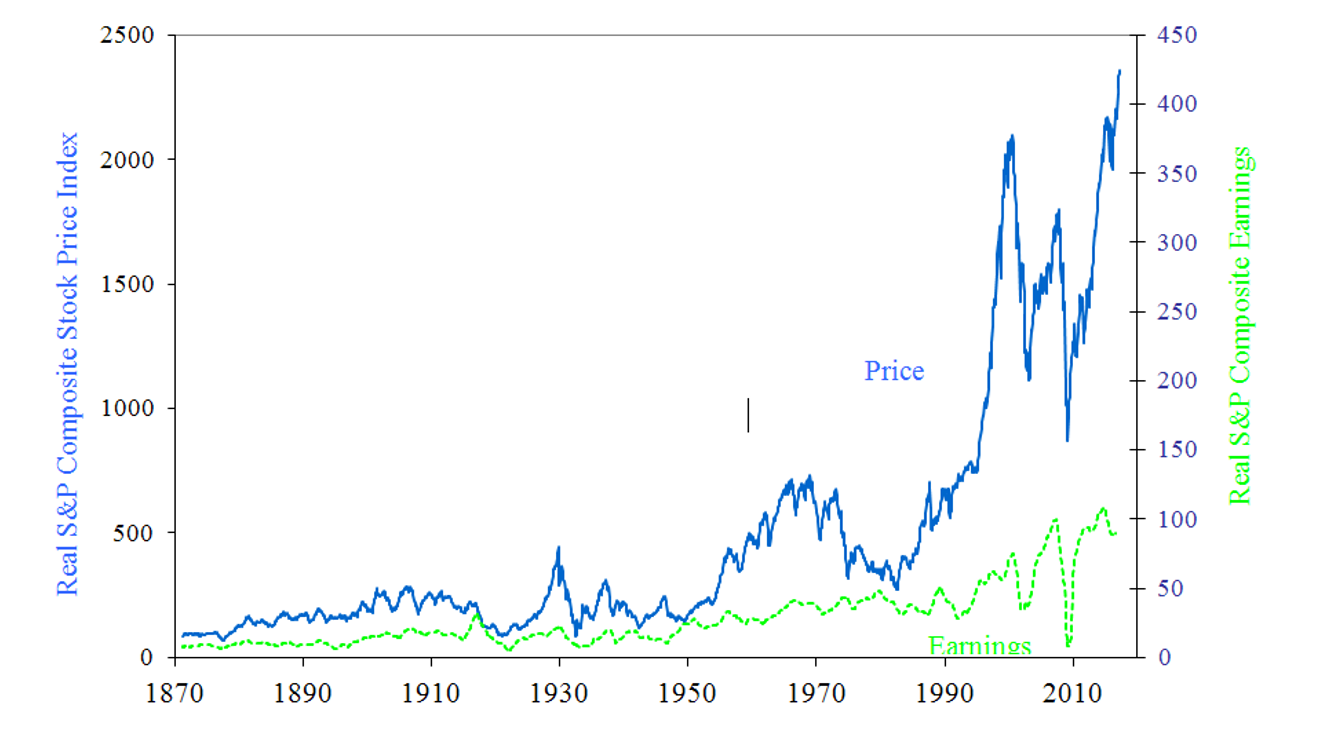
Source: Robert Shiller, multipl.com. Data through January 9, 2018. While no single statistic perfectly describes reality, the CAPE ratio highlights how cheap or expensive the stock market is relative to its historical average. Indeed, comparing the current CAPE ratio of 33.38 to its median value of 16.15, stocks would have to fall by more than 50% to be in line with historical norms. The CAPE chart is more than a historical chart of valuation. It is also a chart of investor psychology compared to historical norms, because the chart measures the investing public’s fear or mania to “buy” a dollar’s worth of stock market earnings at any point in time. For example, a long bull market began in August 1982, when stocks were cheap (CAPE = 7) based on the fearful consensus reasoning of the day. The subsequent 18-year rally mushroomed into the internet stock craze that peaked in March 2000, when stocks were expensive (CAPE = 45), based on manic consensus reasoning of the day. Excluding the tech mania of 2000, today stocks are more highly-valued than at any other time during the past 140 years, even including the peak at the end of the Roaring 1920s. If high valuations are a sign of investor psychology, then investors today are about as optimistic as at any time in the past. Put another way, today’s high valuations indicate that investors see more future upside (reward) than future downside (risk). The psychological effect on stock prices can also be seen in the chart below, which breaks down the PE ratio into P (price) and E (earnings). When the gap between price (blue line) and earnings (green line) is high, investors are willing to pay high a price to buy a dollar of earnings. A glance at the chart shows the same eras of peak valuations occurring in the 1920s, the 1960s, and again over the past two decades. Most recently, during the past few years earnings have been flat while stocks were rising dramatically. While bidding up stock prices during this period, it appears investors were expecting a big jump in earnings. If so, they didn’t receive what they expected. So, if earnings didn’t drive stock prices higher, what did? The inquiring minds of the financial punditry need another narrative.
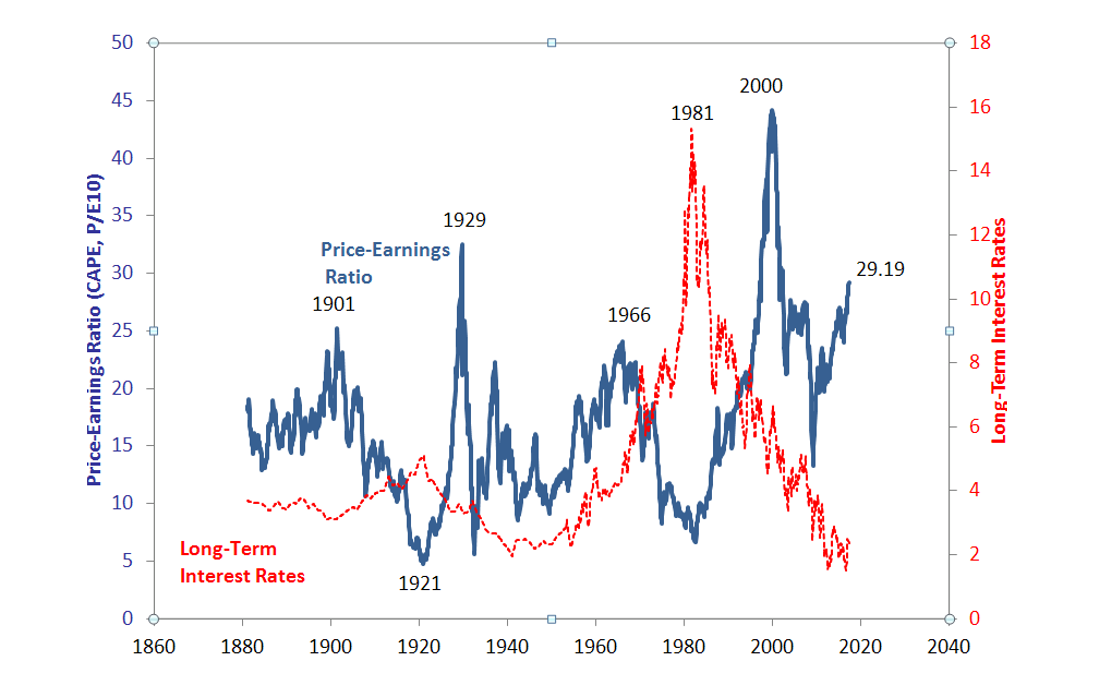
Source: Robert Shiller, multipl.com. Data through June 2017 Regardless of the common sense embedded in the CAPE chart, doubters of the CAPE methodology would probably make arguments driven by “relative value,” not “absolute value.” Relative value arguments state that one asset is valued at price X because another asset is valued at price Y. Let’s substitute stocks for price X and interest rates as price Y. When interest rates (Y) are extremely low, it makes intuitive sense that stock prices (X) would be high, because interest rates are a main theoretical factor in the valuation of stocks. Another sensible argument is that prevailing interest rates provide competition for an investor’s dollar relative to an investment in the stock market. For these reasons, when rates (Y) are low, stocks (X) are perceived to be more attractive, relatively. Indeed, the two charts presented so far only show the relationship between the price of stocks and the earnings of the underlying companies; the charts say nothing about the level of interest rates. Interest rates are the crucial input into the theoretical valuation of stocks. In addition, interest rates are thought to drive the prices of all other assets such as real estate, privately operated businesses, commodities, and currencies. To analyze the relative value argument, let’s look at the interaction of interest rates and stock valuations over the broad sweep of time. As shown below, extremely high stock market valuations occurred in 1929, 2000, and recently. But interest rates were extremely low only once (recently) during those three occurrences. If low interest rates coincide with extremely high stock valuations only one time out of three, then it is obvious that low interest rates cannot cause high stock valuations. Yet “low interest rates cause high stock valuations” is one of the certainties of the current mainstream narrative.
Source: Robert Shiller, multipl.com. Data through June 2017. Isolating the times when interest rates were extremely low, that has occurred twice; in the 1940s and again in recent times. But in the 1940s, stock valuations were low. So, the statement that low interest rates cause high stock valuations is supported by a .500 batting average in the historical record, which is the equivalent of a coin-flip. A better batting average is achieved by the relative value argument that extremely high interest rates coincide with extremely low stock market valuations, which occurred in 1921 and 1981. Although a sample size of two observations is not enough from which to draw a statistically-significant conclusion, at least the batting average is 1.000. Summarizing the historical relationship between extremes in stock market valuations with extremes in interest rates:
Beware the investment advisor, pundit, or superstar investor who is certain that extremely low rates cause extremely high stock valuations, or that a rise in rates from extremely low levels will cause a decline in stock prices. Stocks may fall, and interest rates may rise, but the historical record disagrees that one causes the other.
https://realinvestmentadvice.com
|
Send this article to a friend:
 |
 |
 |
 When the financial media continuously repeat an opinion as fact, it spawns a mainstream narrative, which produces a powerful effect on investor psychology. One mainstream narrative, repeated with certainty, is low interest rates cause high stock market valuations, which is supported by the public statements of investment luminaries such as Warren Buffett.


![[Most Recent Quotes from www.kitco.com]](http://www.kitconet.com/charts/metals/gold/t24_au_en_usoz_2.gif)
![[Most Recent USD from www.kitco.com]](http://www.weblinks247.com/indexes/idx24_usd_en_2.gif)
![[Most Recent Quotes from www.kitco.com]](http://www.kitconet.com/charts/metals/silver/t24_ag_en_usoz_2.gif)