
Send this article to a friend:
January
29
2016

|
Send this article to a friend: January |
|
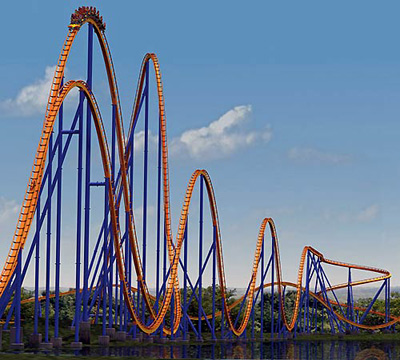
| Latest Twist In The Stock Market's Wild 2016 Ride Dana Lyons
The stock market’s wild ride to begin the year continues, with the latest twist reminiscent of a roller coaster. Over the past 4 days, the Dow Jones Industrial Average (DJIA) has moved at least 1%, with each day alternating up and down. Since 1900, this is the 68th such streak and just the 17th in the past 70 years (actually, today narrowly missed making it 5 days in a row which would have been just the 3rd occurrence in the last 84 years). Now, with most studies that we undertake, we’re at least hopeful of finding some kind of an edge in guiding our investment decisions. After all, this effort is not merely an academic exercise – we are trying to make some money. However, concerning the phenomenon that is the subject of this post, we did not realistically expect to find anything too instructive in navigating the market going forward. That said, there are a few interesting tidbits contained herein. First of all, let’s look at a chart of all of the occurrences since 1900.
As you can see, in the early part of the 20th century, it was not all that uncommon to see these 4-day streaks of alternating 1% up and down moves in the DJIA. In fact, during the epic 1929-1932 bear market, these events were so prevalent that the chart markers cover the entire DJIA line over that period. Now, as we mentioned in yesterday’s post, also on the extreme January volatility, it is common to see elevated volatility near the depths of a bear market. However, the frequency of the events in the 1930′s is still pretty eye-opening to look at. Since 1946, however, there have been just 17 of these streaks now. In fact, the DJIA went from 1946 to 1973 without recording a single instance of these streaks. Similarly, another long drought in signals took place from 1980 to 2002. What makes these streaks so interesting is that they each skipped over the entirety of respective secular bull markets (from 1949-1966 and 1982-2000). Indeed, like yesterday’s post, these bouts of volatility tended to be products of secular bear markets, with this one being even more skewed. Consider the following:
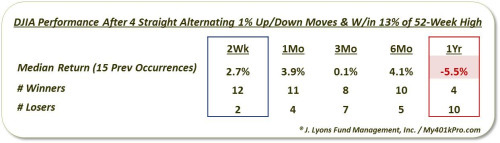
Again, as we mentioned in yesterday’s post, we still consider the market to be in the post-2000 secular bear market (though, that is surely not the popular stance). Thus, we would include the 3 occurrences since 2010 in the secular bear category. Technically, the only ones that did not occur within a secular bear were 2 occurrences in April 1929. However, those did occur close enough to the onset of the crash later that year that we’ll include them with the secular bear events. One more thing to note is that, like we mentioned before, it is more common to see elevated volatility after considerable market weakness. Although, it certainly can appear after just a short, but sharp decline, as in our present case. That said, we take a bit more interest in those streaks that occurred after relatively small declines as extreme volatility is less typical at those times. Our current streak has the DJIA just under 13% from its 52-week high. Thus, we looked at all instances occurring within 13% of the DJIA’s 52-week high. There have been 16 streaks now meeting this condition, with half of those occurring since 1973. Again, we’re not placing a whole lot of confidence in prior events serving as a guide to our present circumstances. However, the performance of the DJIA following the 15 previous occurrences is somewhat interesting at least.
In the short-term, the DJIA showed a tendency to bounce, in particular over the following 2 weeks. 12 of the 15 occurrences saw higher prices (1 was unchanged), with the median return at +2.7%. In the longer-term, it was a different story, however. 1 year later, 10 of the 15 were lower. The 2/2/2015 event has yet to record a 1-year return, but barring just about the biggest 3-day rally ever, by next Tuesday it will be 11 out of 15 that were lower 1 year later. One more time, we do not put a ton of stock in these results. They surely will not dictate much of our thinking in terms of executing our investment approach. However, again, perhaps the most relevant takeaway is that bad stuff tends to happen in bad markets. This includes volatility spikes. Thus, the presence of this recent 4-day roller coaster is perhaps a clue that our present market landscape is not a healthy one. * * *
|
|---|
Send this article to a friend:
 |
 |
 |
 The Dow Jones Industrial Average just alternated 1% moves up and down for 4 days in a row – just the 17th such stretch in the last 70 years.
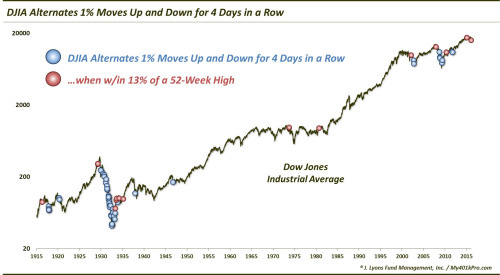
 Dana Lyons is a partner at J. Lyons Fund Management, Inc., a Registered Investment Advisor and founder of My401kPro.com. He is a veteran of nearly 20 years in the investment industry as a portfolio manager, analyst and commodities trader and is an original Yahoo Finance Contributor. Dana has a Bachelor of Science degree in Economics with a major in Finance from the Wharton School of Business at the University of Pennsylvania where he was also an All-Ivy League football player. He lives in Chicago with his wife, Dana (seriously, same name) and 3 children. (DL: “Our oldest child is 3…did I mention I’m a manager and not a planner?”)