Send this article to a friend:
January
24
2014

|
Send this article to a friend: January |
|
Thoughts from the Frontline: Forecast 2014: "Mark Twain!" 
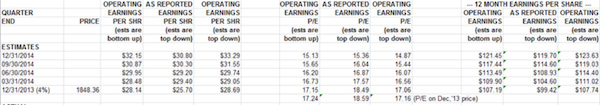
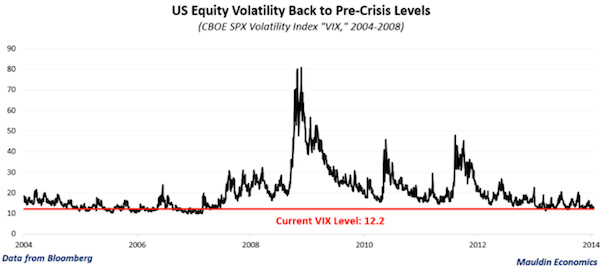
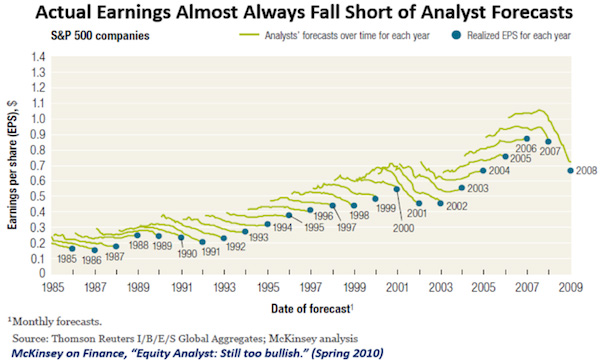
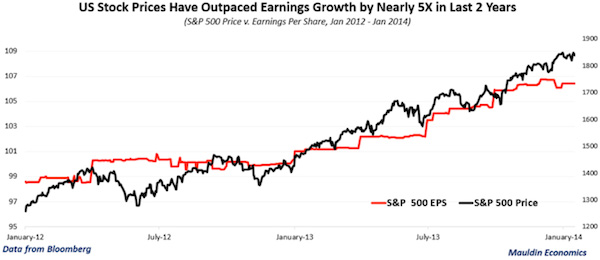
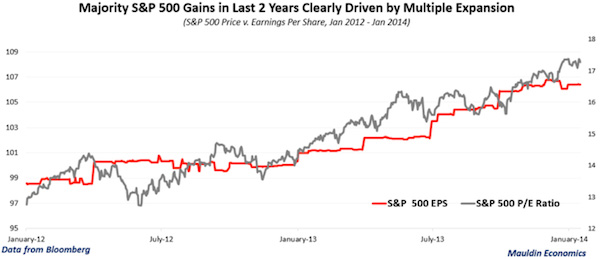
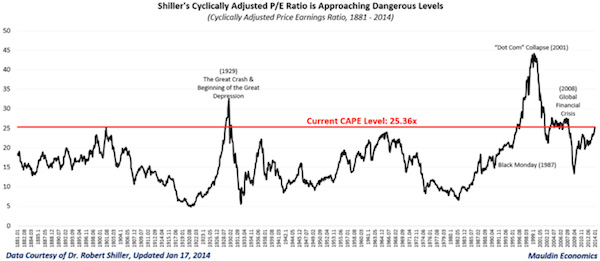
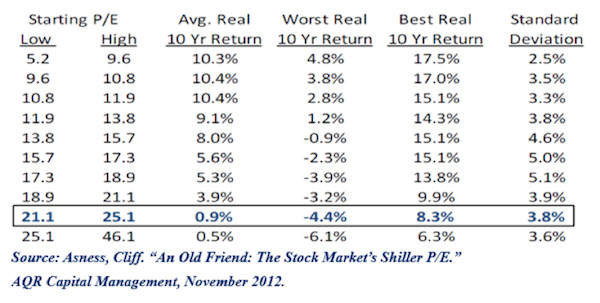
Piloting on the Mississippi River was not work to me; it was play — delightful play, vigorous play, adventurous play – and I loved it… – Mark TwainIn the 1850s, flat-bottom paddlewheel steamboats coursed up and down the mighty Mississippi, opening up the Midwest to trade and travel. But it was treacherous travel. The current was constantly shifting the sandbars underneath the placid, smoothly rolling surface of the river. What was sufficient depth one week on a stretch of the river might become a treacherous sandbar the next, upon which a steamboat could run aground, perhaps even breaching the hull and sinking the ship. To prevent such a catastrophe, a crewman would throw a long rope with a lead weight at the end as far in front of the boat as possible (and thus the crewman was called the leadman). The rope was usually twenty-five fathoms long and was marked at increments of two, three, five, seven, ten, fifteen, seventeen and twenty fathoms. A fathom was originally the distance between a man's outstretched hands, but since this could be quite imprecise, it evolved to be six feet. The leadsman would usually stand on a platform, called "the chains," which projected from the ship over the water, and "sound" from there. A typical sound would be expressed as "By the mark 7," or whatever the depth was. In modern English language, it is interesting to note that the expression "deep six," refers to this old method of measuring water. On the Mississippi River in the 1850s, the leadsmen also used old-fashioned words for some of the numbers; for example instead of "two" they would say "twain". Thus when the depth was two fathoms, they would call "by the mark twain!" (bymarktwain.com) And thus a young Samuel Clemens, apprentice Mississippi riverboat pilot, would take the "soundings" and from time to time would sing out the depth of two fathoms as "By the mark twain!" We think that is how he found his pen name. In Life on the Mississippi, Mark Twain describes sounding: "Often there is a deal of fun and excitement about sounding, especially if it is a glorious summer day, or a blustering night. But in winter the cold and the peril take most of the fun out of it." The pilot would much prefer to hear the sweet sing-song call of "no bottom," as that meant there was no danger of running aground. "Mark twain," or 12 feet, was getting rather shallow for some of the larger vessels and so sounded a note of caution. On their surface today the markets seem as smooth and flowing as Old Man River, but are there sandbars lurking in the depths? Will the journey this year be as fast and easy as in the last five? Can we plunge on into the night, relishing the call of "No bottom" that we are hearing from the bulls? Or is that a cry of "Mark twain!" telling us to be cautious? Perhaps we should take our own soundings from the data to see what might lie up ahead. This week, in the third part of my 2014 forecast, we'll look in particular at the US markets as a proxy for markets in general. (This letter will print a little longer as there are lots of charts.) But first, I am pleased to announce that my friend former House Speaker Newt Gingrich will be at my conference this May 13-16 in San Diego, joining (so far) Niall Ferguson, Kyle Bass, Ian Bremmer, David Rosenberg, Dr. Lacy Hunt, Dylan Grice, David Rosenberg, David Zervos, Rich Yamarone, Code Red coauthor Jonathan Tepper, Jeff Gundlach, Paul McCulley, and a few more surprises waiting to confirm. Nothing but headliners, one after the other. When I first broached the idea of our conference with Jon Sundt, the founder of cosponsor Altegris, the one rule I had was that I wanted the conference to be one I would want to attend. The usual conference boasts a few headliners, and then the sponsors fill out the lineup. I wanted to do a conference where no speaker could buy his way onto the platform. That means we often lose money on the conference (hard as that may be to imagine, at the price, I acknowledge); however, the purpose is not to make money but to learn with – and maybe have some fun with – great people. We do put on a great show, and my partners make sure it is run well. But the best part will be your fellow attendees. A lot of long-term friendships are forged at this conference. You can learn more and sign up at http://www.altegris.com/sic. It's All About the Earnings For over a dozen years I have regularly compared notes on S&P 500 earnings with my friend Ed Easterling. For Ed, the subject borders on an obsession. I am, of course, far more reserved in my enthusiasm. We have co-authored numerous articles, and Ed never fails to call to my attention anything unusual that happens on the earnings front. He is the ultimate data wonk, and I say that in an affectionate way. Ed has what I think is one of the best data research sites anywhere at www.crestmontresearch.com. So this week I read his latest email, about the uptick in the forecast earnings of the S&P 500, with considerable interest. As they do at this time of year, S&P posted an update to their 2014 EPS (earnings per share) forecast. For newbies, "as-reported" earnings are earnings as reported to the tax authorities, and we can more or less think of them as real earnings. "Operating earnings," on the other hand, are what companies like you to pay attention to. They exclude one-time charges and other things that companies find inconvenient. I call operating earnings "EBIH earnings" – earnings before interest and hype. S&P conveniently gathers forecasted earnings data from numerous analysts and amalgamates it in one big spreadsheet along with the history of actual earnings. You can access their spreadsheet here. The data we will be looking at will come from the first tab, but there is also a lot of data commentary from Howard Silverblatt, the longtime curator and maven of all things earnings. The forecast for 2014 as-reported earnings was $106 in late December. Now it's $119.70 – up 13% from the previous forecast just two weeks ago and up 20% versus the 2013 estimate of $99.42. Since 2013 has concluded, that number will be revised only slightly. Silverblatt says the revised figure is based upon an improved outlook rather than something technical like an accounting change. The table below is a screenshot from the Excel spreadsheet. Note that, depending on which set of earnings you want to use (and Ed and I prefer to use as-reported as opposed to operating earnings), if the forecasters are right, then the P/E ratio at the end of 2014 will be in the neighborhood of 15, less than the long-term average and down considerably from today's. This can only be described as a bullish number. Ed notes in a quick email, which spurred a long telephone conversation, that "The 2015 forecast is still a month or so away – yet just imagine the bull stampede if it comes in +15%. That'll would take the figure to $138 and a forward "next year" P/E of only 13 when the trailing 20-year Shiller P/E10 is 25.4." I would have ended that sentence with an exclamation point (!), but Ed is more even-tempered in his writing. Still, a price-to-earnings ratio of 13, published on the official S&P website for all the world to see, would have the bulls salivating. It would even have me close to "pounding-the-table-bullish," as a true P/E of 13 is quite favorable for the long term (say, ten years). So should we take the forward-looking view? If that P/E ratio of 13 based on today's price of the S&P 500 turns out to be the reality, another 30% year is well within the scope of possibilities and might likely be considered the most probable outcome. And the markets seem to think that will be the case. Lately, it seems every week (and sometimes every day) brings a new all-time high. For fans of Mad magazine, it's an Alfred E. Newman world: "What? Me worry?" Volatility is back at pre-crisis lows, as the chart below illustrates. This kind of news would normally point to prosperity across the real economy and call for a celebration – but take heed: prices do not always reflect reality, and analysts' expectations consistently tend to overstate actual earnings, as you can see in the following graph from a 2010 McKinsey on Finance Study, Equity analysts: Still too bullish. When that graph gets updated next year, we will see that nothing has changed. For the record, I was citing similar research back in 2003 in my book Bull's Eye Investing. In fact, there was a whole chapter on the topic of analysts' estimates. They also tend to be too bearish at market bottoms. Basically, analysts tend to forecast for the near future more of what has happened in the recent past. At turning points they really miss the boat. If we look at recent years in light of long-term valuations and market behavior, we see that the combination of high and rising valuations, low and suppressed volatility, and a relatively weak trend in real earnings growth is a proven recipe for poor long-term returns and market instability. The S&P 500 Index returned 32% excluding dividends from January 1, 2012, through January 17, 2014. Over that time frame, real earnings grew by less than 8%... … while the trailing 12-month price-to-earnings multiple has expanded by nearly 30%, from 12.8x to 17.3x. That means most of the recent gains in US equity markets have been driven by multiple expansion, in spite of sluggish real earnings growth. Despite an improvement in the real earnings trend since I dug into US stock market valuations, multiple expansion, and earnings last August, the disproportionate amount of gains attributable to multiple expansion versus gains attributable to earnings is a clear sign that sentiment, rather than fundamentals, may be the dominant force driving the markets higher. Of course, the simple trailing 12-month price-to-earnings ratio can be misleading at critical turning points if you are trying to handicap the potential for long-term returns. For example, the collapse in real earnings during the global financial crisis sent the S&P 500's trailing P/E multiple through the roof by March 2009. So, while trailing P/E is a useful tool for understanding what has already happened in the market, Dr. Robert Shiller's "cyclically adjusted price-to-earnings ratio" (commonly known as the "Shiller P/E" or "CAPE") is far more useful for calculating a reasonable range of expected returns going forward. As I wrote back in August 2013 when the prevailing Shiller P/E sat near 24, this approach won't help you much with short-term market timing; but current valuations have historically proven extremely useful in forecasting long-term returns. In his book Irrational Exuberance (2005), Dr. Shiller shows how this approach "confirms that long-term investors – investors who commit their money to an investment for ten full years – did do well when prices were low relative to earnings at the beginning of the ten years. Long-term investors would be well-advised, individually, to lower their exposure to the stock market when it is high … and to get into the market when it is low." As you can see in in the graph above, compared to the more common trailing 12-month P/E ratio, the Shiller P/E metric essentially smooths out the series and helps us avoid false signals by dividing the market's current price by the average inflation-adjusted earnings of the past ten years. Historically, this ratio has peaked and given way to major market declines at around 29x on average (or 26x excluding the dot-com bubble), and it has bottomed in the mid-single digits. Not only does today's Shiller P/E of 25.4x suggest a seriously overvalued market, but the rapid multiple expansion of the last few years, coupled with sluggish earnings growth, suggests that this market is also seriously overbought. Today's markets are just slightly less expensive than the 27x level seen at the October 2007 market peak and are only modestly below the levels seen before the stock market crash in 1929. Although we are nowhere near the all-time "stupid" peak of 43x reached in March 2000, a powerful narrative drove the markets to clearly unsustainable levels then, and a powerful narrative is driving markets today. In many ways, faith in the Federal Reserve today is roughly equivalent to faith in the words dot com in 1999. While it may be impossible to accurately predict when this policy-driven market will break, history suggests it would be very reasonable for the secular bear to eventually bottom at a P/E multiple between 5x and 10x, opening up one of the rare wealth-creation opportunities to deploy capital at truly cheap prices. Sometimes we have to wade through what may seem like deceptively dry technical details to sort out compelling conclusions, but I hope you'll focus on the main idea: We are not talking about the potential for a modest 20% to 30% drawdown in the US stock market. If the historical relationship between Shiller's P/E and consequent returns is any indication, we are talking about the potential for a 50%+ peak-to-trough drawdown and ten-year average annual returns as bad as -6.1%, according to the chart below from Cliff Asness at AQR. Such a result would fall in line with somewhat similar deleveraging periods such as the United States experienced in the 1930s and Japan has experienced since 1989. There is no way to sugarcoat it: too much equity risk can be unproductive and even destructive in this kind of economic environment. But where there is danger there is also opportunity. I believe this is a terrific time to take some profits and diversify away from the growth-oriented risk factors that dominate most investors' portfolios. On that front, keep a lookout for a special report that we will release in the next week to share five critical steps you can take to defend your portfolio from economic disasters, bankrupt governments (or governments that are testing their borrowing limits), and increasingly desperate governments. It will be a free report for all Thoughts from the Frontline readers, and we hope you will share it with everyone you know. To continue reading this article from Thoughts from the Frontline – a free weekly publication by John Mauldin, renowned financial expert, best-selling author, and Chairman of Mauldin Economics – please click here. © 2013 Mauldin Economics. All Rights Reserved. Please write to [email protected] to inform us of any reproductions, including when and where copy will be reproduced. You must keep the letter intact, from introduction to disclaimers. If you would like to quote brief portions only, please reference www.MauldinEconomics.com. To subscribe to John Mauldin's e-letter, please click here: www.mauldineconomics.com/subscribe Thoughts From the Frontline and MauldinEconomics.com is not an offering for any investment. It represents only the opinions of John Mauldin and those that he interviews. Any views expressed are provided for information purposes only and should not be construed in any way as an offer, an endorsement, or inducement to invest and is not in any way a testimony of, or associated with, Mauldin's other firms. John Mauldin is the Chairman of Mauldin Economics, LLC. He also is the President and registered representative of Millennium Wave Advisors, LLC (MWA) which is an investment advisory firm registered with multiple states, President and registered representative of Millennium Wave Securities, LLC, (MWS) member FINRA and SIPC, through which securities may be offered. MWS is also a Commodity Pool Operator (CPO) and a Commodity Trading Advisor (CTA) registered with the CFTC, as well as an Introducing Broker (IB) and NFA Member. Millennium Wave Investments is a dba of MWA LLC and MWS LLC. This message may contain information that is confidential or privileged and is intended only for the individual or entity named above and does not constitute an offer for or advice about any alternative investment product. Such advice can only be made when accompanied by a prospectus or similar offering document. Past performance is not indicative of future performance. Please make sure to review important disclosures at the end of each article. Mauldin companies may have a marketing relationship with products and services mentioned in this letter for a fee. Note: Joining The Mauldin Circle is not an offering for any investment. It represents only the opinions of John Mauldin and Millennium Wave Investments. It is intended solely for investors who have registered with Millennium Wave Investments and its partners at http://www.MauldinCircle.com (formerly AccreditedInvestor.ws) or directly related websites. The Mauldin Circle may send out material that is provided on a confidential basis, and subscribers to the Mauldin Circle are not to send this letter to anyone other than their professional investment counselors. Investors should discuss any investment with their personal investment counsel. John Mauldin is the President of Millennium Wave Advisors, LLC (MWA), which is an investment advisory firm registered with multiple states. John Mauldin is a registered representative of Millennium Wave Securities, LLC, (MWS), an FINRA registered broker-dealer. MWS is also a Commodity Pool Operator (CPO) and a Commodity Trading Advisor (CTA) registered with the CFTC, as well as an Introducing Broker (IB). Millennium Wave Investments is a dba of MWA LLC and MWS LLC. Millennium Wave Investments cooperates in the consulting on and marketing of private and non-private investment offerings with other independent firms such as Altegris Investments; Capital Management Group; Absolute Return Partners, LLP; Fynn Capital; Nicola Wealth Management; and Plexus Asset Management. Investment offerings recommended by Mauldin may pay a portion of their fees to these independent firms, who will share 1/3 of those fees with MWS and thus with Mauldin. Any views expressed herein are provided for information purposes only and should not be construed in any way as an offer, an endorsement, or inducement to invest with any CTA, fund, or program mentioned here or elsewhere. Before seeking any advisor's services or making an investment in a fund, investors must read and examine thoroughly the respective disclosure document or offering memorandum. Since these firms and Mauldin receive fees from the funds they recommend/market, they only recommend/market products with which they have been able to negotiate fee arrangements. PAST RESULTS ARE NOT INDICATIVE OF FUTURE RESULTS. THERE IS RISK OF LOSS AS WELL AS THE OPPORTUNITY FOR GAIN WHEN INVESTING IN MANAGED FUNDS. WHEN CONSIDERING ALTERNATIVE INVESTMENTS, INCLUDING HEDGE FUNDS, YOU SHOULD CONSIDER VARIOUS RISKS INCLUDING THE FACT THAT SOME PRODUCTS: OFTEN ENGAGE IN LEVERAGING AND OTHER SPECULATIVE INVESTMENT PRACTICES THAT MAY INCREASE THE RISK OF INVESTMENT LOSS, CAN BE ILLIQUID, ARE NOT REQUIRED TO PROVIDE PERIODIC PRICING OR VALUATION INFORMATION TO INVESTORS, MAY INVOLVE COMPLEX TAX STRUCTURES AND DELAYS IN DISTRIBUTING IMPORTANT TAX INFORMATION, ARE NOT SUBJECT TO THE SAME REGULATORY REQUIREMENTS AS MUTUAL FUNDS, OFTEN CHARGE HIGH FEES, AND IN MANY CASES THE UNDERLYING INVESTMENTS ARE NOT TRANSPARENT AND ARE KNOWN ONLY TO THE INVESTMENT MANAGER. Alternative investment performance can be volatile. An investor could lose all or a substantial amount of his or her investment. Often, alternative investment fund and account managers have total trading authority over their funds or accounts; the use of a single advisor applying generally similar trading programs could mean lack of diversification and, consequently, higher risk. There is often no secondary market for an investor's interest in alternative investments, and none is expected to develop. You are advised to discuss with your financial advisers your investment options and whether any investment is suitable for your specific needs prior to making any investments. All material presented herein is believed to be reliable but we cannot attest to its accuracy. Opinions expressed in these reports may change without prior notice. John Mauldin and/or the staffs may or may not have investments in any funds cited above as well as economic interest. John Mauldin can be reached at 800-829-7273. |
|---|
Send this article to a friend:
 |
 |
 |