Send this article to a friend:
January
25
2014

|
Send this article to a friend: January |
|
The Coming Bust 
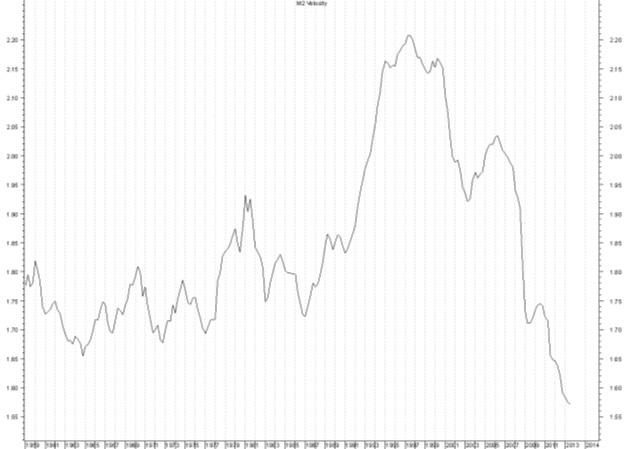
Regardless of what we hear from various sources, fact is, the economy peaked in 2000. This peak corresponded with the stock market top in 2000, which was followed by the decline into the 2002 low. Since that decline began, the money masters have tried to reignite the underlying economy and in the process they have only made matters worse. Seriously, rather than letting the mainstream media tell you what to think, stop and think for a minute with some basic emotionless common sense. If the economy was so good, then why did the money masters cut interest rates following the 2000 top? It's simple, in their own words, they were trying to "stimulate aggregate demand." Why? Because the economy had peaked and they were trying to jump start it, again. Obviously, if the economy had been sound, these measures would not have been needed. As the 4-year cycle advance out of the 2002 low continued pressing higher and higher, I specifically said in interviews and in articles posted here that they were only making matters worse. All the while, even Greenspan denied the housing bubble, which is exactly what I mean when I say think for yourself. The housing bubble was obvious, yet they tried to tell us that it did not exist. I guess the main point here is to simply watch what they do rather than what they say. Kind of like the old saying, actions speak louder than words. They are telling us one thing and doing another. In the end, the efforts to re-inflate the economy following the decline into the 2002 low did in fact make matters worse and it resulted in the worst financial disaster since the 1930s. This now brings me to the current situation. I said when the advance out of the 2009 low began, that it was a bear market rally and that the longer it lasted the more dangerous it would become. I also said that it would, however, continue until the proper statistical based setup to cap it was seen. At that time I did not realize just how profound this statement was. Honestly, I had no idea that this advance would last this long or that it would carry price to these levels. However, I still stand by these statements. The rally out of the 2009 low has NOT been based on a solid technical, fundamental or economic foundation. Rather, it has been based on the same phony smoke and mirrors liquidity driven actions that caused the housing crisis, a commodity bubble and a banking crisis, which all resulted in the worst financial disaster since The Great Depression. But, what do the money masters do as a result of that crisis? More of the same that created it in the first place. So, here's another common sense question. How or why should we expect more of the same behavior that created the worst financial crisis since The Great Depression to yield a different result this time? I think this is particularly true given that it's being done on the back of the same rotten economic foundation. Back in 2009 when I said that the longer this rally lasted the more dangerous it would become, I was referring to the fact that the longer it lasted, the more convincing it would become and that as a result it would draw more and more people into it. Given the underlying technical, economic and fundamental foundation, this has now turned into what I think will prove to be the greatest bear trap of all. An example of the degree to which this rally has become convincing is evident by the Investors Intelligence sentiment data, which is at the highest levels seen since February 1987. As for the state of the economy, I want to share one simple chart with you. That being a chart of the Velocity of M-2, which can be found below. Let's first define what the velocity of money is. Perwww.investopedia.com, it is "the rate at which money is exchanged from one transaction to another, and how much a unit of currency is used in a given period of time. Velocity of money is usually measured as a ratio of GNP to a country's total supply of money. Velocity is important for measuring the rate at which money in circulation is used for purchasing goods and services. This helps investors gauge how robust the economy is, and is a key input in the determination of an economy's inflation calculation."
Now with this established, let's examine the chart. First, I want to point out that it peaked in mid-1997, which supports my theory that the economy peaked in 2000. It is interesting to note that from a cyclical perspective the 1997 top occurred just ahead of the 1998 4-year cycle top in equities, which created a non-confirmation that was followed by a decline into the 1998 4-year cycle low by equities. The velocity of M-2 bottomed in early 1999 and then advanced as equities moved into their 2000 4-year cycle top. But again, with the velocity chart peaking ahead of equites, a non-confirmation occurred, which was followed by the decline into the 2002 4-year cycle low. The velocity of M-2 turned up in early 2003 in association with the 4-year cycle advance in equities. But, notice that the velocity of M-2 peaked in early 2006, which again formed a non-confirmation with equities as they continued up into October 2007 and which was followed by the decline into the 2009 4-year cycle low. Now, let's refer back to the definition of the velocity of money........"Velocity is important for measuring the rate at which money in circulation is used for purchasing goods and services. This helps investors gauge how robust the economy is, and is a key input in the determination of an economy's inflation calculation." Appears to me that this definition it pretty accurate. It's an indisputable fact that these non-confirmations clearly show the underlying economic slow down and it is indisputable what followed. Now, in association with the advance out of the 2009 4-year cycle low, the velocity of M-2 bottomed along with equities in early 2009, but it peaked in mid-2010, which with the stock market having continued higher, has formed yet another non-confirmation. Is there perhaps a pattern here? But, more importantly, when we stand back and look at the velocity of M-2 as a whole, note that it has been moving progressively lower since its 1997 peak. This clearly shows that the economy did in fact peak in or around the 2000 time frame. This one chart also clearly shows what the money masters have been fighting ever since. With the velocity of M-2 at levels not seen since the inception of this data in 1959, how in the world can anyone argue that we are in an economic recovery? The very definition of the velocity of money argues otherwise. I will also argue that the continued actions of the money masters is evidence to this effect as well. Point being, if things were so great, would the extreme measures seen had been necessary? Watch their actions, not what they say. With the velocity of money having drifted lower and lower ever since the 2000 stock market top and with the knowledge of this chart, how can anyone honestly argue that we have been in a secular bull market? In fact, this one chart alone pretty well confirms that I'm right about this being a bear market rally as was the case with the advance into the 2007 top. This one chart clearly shows what the money masters have been fighting since 2000. That being, a deflationary and contracting economy. It's all one big phony secular bear market advance. More importantly, this chart also clearly shows that all of the efforts to "stimulate aggregate demand," in order to reignite the economy, has not worked. In fact, this chart shows that it has out right failed. My long-term cyclical, statistical and Dow theory work has told me all along that this is a bear market rally and I continue to stand by that opinion. I also continue to stick with my guns that the statistical based research will tell me when this advance has run its course. Given the underlying economic, technical and fundamental back drop in which this smoke and mirrors phony liquidity driven bear market rally has occurred, along with the continued efforts that created the worst financial disaster since The Great Depression, I am truly concerned that the current bubble, yes bubble, will result in an even worst financial disaster. This situation is so serious that I am not just worried about the implications for the stock market and the economy, but also the social and political implications that could well follow. In spite of the fact that the market is sitting at new highs, along with the associated bullish sentiment, the market and the economy are rotten at the core. I don't care what economist, analyst or Phd says otherwise. My data tells me otherwise. This is a bear market rally that is not apt to end well. Many try to discredit such thinking and my only response to that is that anyone trying to do so is either uninformed as to the totality of the supportive data, as was presented here in one small way with the M-2 chart, or they are deceptive. The potential for a financial apocalypse is enormous. In the meantime, this madness will continue until the proper setup to cap it is seen. At which time, it will be checkmate for the market and the economy. Just as the practices that stretched the last bear market rally up into the 2007 4-year cycle top only served to make matters worse, so is it apt to be the case this time. You have been warned! If you would like to know more about my statistical based research, the associated cycles, Dow theory, the setup required to cap this advance, commodities, gold, the dollar and the related developments as they occur, it is available in my research letters at cyclesman.com I used these methods to warn and identify the 2000 top in equities as well as the 2007 top, the housing top, the 2008 commodity top and the 2011 top in gold. If you would like much more detailed research that is based on sound technical and statistical methods, that research is available at www.cyclesman.net |
|---|
Send this article to a friend:
 |
 |
 |