Send this article to a friend:
January
14
2014

|
Send this article to a friend: January |
|
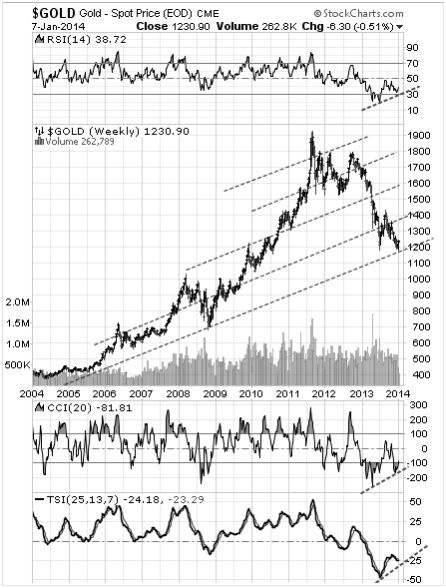
Is Now The Time To 'Back Up The Truck'  According to a famous trader of the past, W. D. Gann: "Time is more important (in markets), than price; when time is up, price will reverse." It has now been 29 months since gold last reached a new high in its current bull market cycle. The downtrend lasted 22 months (top to bottom), having bottomed on June 28th 2013 at $1180. Confirmation of the bottom came on Dec 31 when gold briefly touched $1182, and left behind a double bottom, see chart #3. There have been two other corrections that lasted 6 months or more, from top to bottom: In 2006 gold declined for 6 months, and in 2008 the pullback took 8 months to bottom. Thus a 22 month down-cycle qualifies under the Gann definition as 'time is up'. There have been 4 pullbacks of 16% or more since gold began its current bull market run in 2002. In 2003 price dropped 16%; in 2006 – 23%; in 2008 – 30% while the correction that began on Sept 7th 2011 and ended June 28th 2013 caused a decline of 38.5%. This number is close enough to be a Fibonacci retracement (technically at 38.2%), to have run its course. For some reason, the higher the price, the deeper is the eventual pullback. By extrapolating these numbers, the next major correction could very well cause a 50% price reduction. Possible numbers could be from a top at $3,850 down to support at $1,925. That scenario is a few years down the road. *Charts courtesy Stockcharts.com unless indicated.
Featured is the weekly gold chart. Despite the 22 month long decline (from top to bottom), the bull market is intact. The short-term double bottom (June to December), is receiving positive confirmation from the supporting indicators.
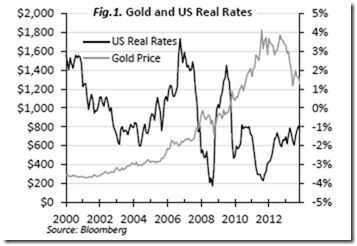
This chart courtesy Bloomberg and the Tocqueville Letter, shows the US Real Interest Rate (TBIL - CPI), remains negative, even while the CPI understates inflation. Negative real rates provide energy for a gold price bull market.
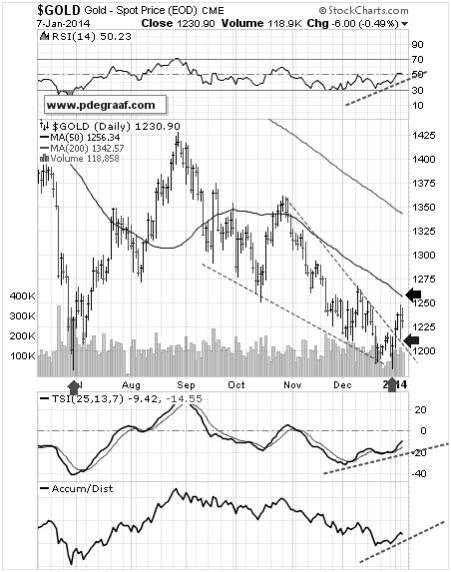
Featured is the daily bar chart for gold bullion. The green arrows point to identical 'upside reversals'. The first one came at $1180 and the second one at $1182 (see green arrows). A double bottom does not come much better than that! The blue arrow shows a breakout from a bullish falling wedge. The supporting indicators are positive, including the all-important Accumulation/Distribution line at the bottom. A breakout at the black arrow will confirm the double bottom formation and this in turn will cause a lot of bears to become bulls.
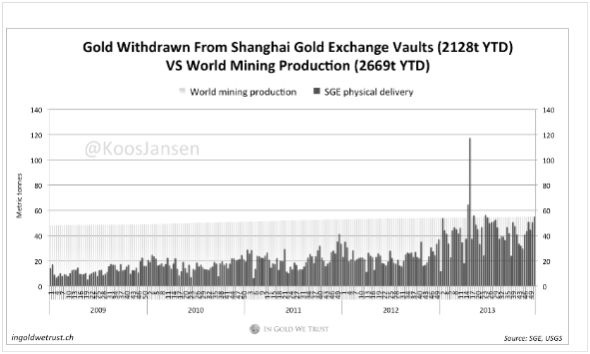
This chart courtesy @KoosJansen shows the amount of physical gold withdrawn from the Shanghai Exchange (red bars), compared to the total amount of gold produced worldwide (yellow background). During a number of months in 2013 the Chinese bought every ounce that the mines of the world were producing.
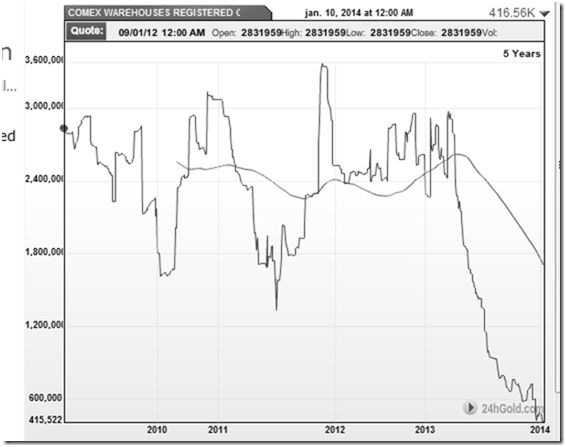
This chart courtesy 24hgold.com shows the number of ounces of gold at the COMEX available for delivery, has dwindled to 416.56 thousand. When this number nears zero, the COMEX will declare 'force majeure', and a number of traders who thought they owned gold bullion will have to settle for pieces of paper. "But then, finally, the masses wake up. They become suddenly aware of the fact that inflation is a deliberate policy and will go on endlessly. A breakdown occurs. The Crack- Up-Boom appears. Everybody is anxious to swap their money against "real" goods, whether he needs them or not, no matter how much money he has to pay for them. Within a very short time, within a few weeks or even days, the things which were used as money are no longer used as media of exchange. They become scrap paper. Nobody wants to give away anything against them." ….…Ludwig von Mises.
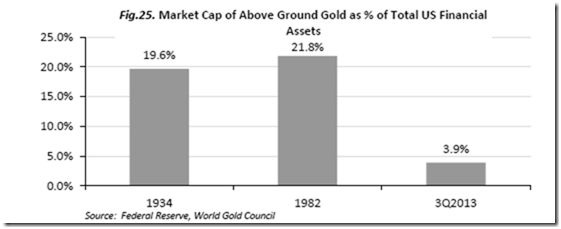
This chart courtesy sources listed, shows the percentage of Total US Financial Assets that are concentrated on Gold at present, as compared to the times when the gold price peaked.
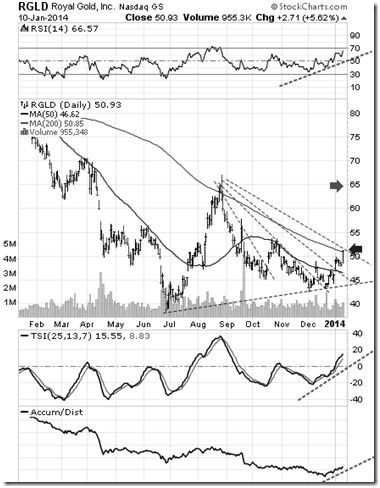
Featured is the daily bar chart for Royal Gold. It trades on the NASDAQ under RGLD, and on the TSX under RGL.TO. Many traders and investors consider this stock to be a bellwether for the gold mining sector. Since carving out a secondary, (ABC) bottom in December, there have already been a number of upside breakouts. The supporting indicators are positive. The next breakout, at the blue arrow, will set up a target at the green arrow. RGL is setting a positive example for the rest of the gold mining industry.
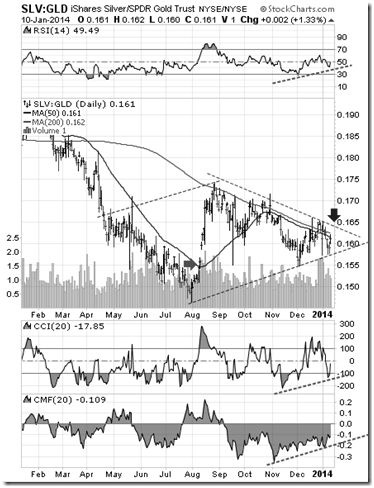
Featured is the index that compares silver to gold. The trend has favored silver since August. The supporting indicators are slowly turning positive again. A breakout at the blue arrow will set up rally similar to the one that started at the green arrow. This will be bullish for both metals but especially for gold. "Under capitalism, men provide for themselves; while under Socialism they are provided for". …Ludwig von Mises.
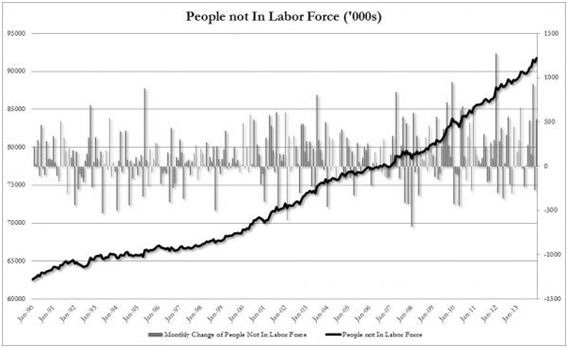
This chart courtesy Zerohedge.com shows the number of people not in the Labor Force has reached an all-time high of 91.8 million. (Macy's just announced that they are closing 5 stores and laying off 2,500 workers). If the people who have given up looking for work were included with the BLS unemployment statistics, the unemployment rate would be at least 11.5%. FED chief Janet Yellen has expressed concern for the unemployed in some of her speeches. The expectation is that she will opt for more QE rather than less, as her way of 'solving this problem'. More QE represent more monetary inflation. Gold and silver will benefit. Disclaimer: Investing involves risk. Please do your own due diligence. Peter Degraaf is not responsible for your trading decisions. Peter Degraaf has over 50 years of investing experience. He publishes a daily market letter for his many subscribers. For a sample copy of a recent issue, send him an E-mail, or visit his website www.pdegraaf.com  Peter Degraaf became interested in silver and gold when the Governments of the US and Canada proceeded to remove silver coinage from circulation in the mid 1960s. He noticed the effect of Gresham's law: "Bad money drives out good." He became a coin dealer, attending coin shows all over The US and Canada. In 2001 he semi-retired from coin sales and concentrated on investing in precious metals. He mastered the art of technical analysis and applies this to his investments. In 2001 he started publishing a daily and weekly market report. His website is at http://www.pdegraaf.com/. |
|---|
Send this article to a friend:
 |
 |
 |