|
Deadly Dow 36,000 & The Secret History Of A 70% Market Loss
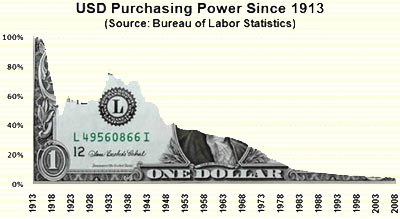
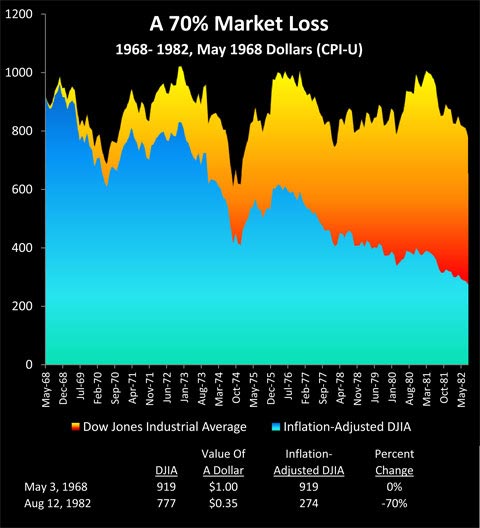
Some investors fear that the Dow may go to 4,000 or 5,000. Surely that would be bad, but there is a worse possibility to consider, which is that the Dow could go to 36,000 instead. Now, Dow 36,000 may sound like a "problem" that most investors would love to have! So what's the danger? To demonstrate why Dow 36,000 could be a nightmare scenario, we will begin with a review of how 70% of stock investor wealth was annihilated the last time the US endured the combination of sustained high unemployment and high rates of monetary inflation. Using a series of simple steps, we will pierce through the generally accepted but false narrative about that market, and show how even with an assumption of "perfect" market timing - that is, buying on the best single day over a near 12 period, and selling on the best single day over an almost 10 year period - that the historical end result was still crippling investor losses, caused by three distinct wealth-destroying forces. We will then move to today's financial world, and show how the little understood interplay between these same three deadly wealth destroyers could create the glittering illusion of wealth that would be Dow 36,000 - even while wiping out 80% of real investment values. How Inflation Hid A 70% Market Loss: 1968-1982History has already shown us what can happen to long term investment returns when persistent high inflation collides with stubborn high unemployment, resulting in stagflation. Consider the graph below. As shown in yellow, the Dow Jones Industrial Average reached 919 in May of 1968, and by August of 1982, had fallen to a level of 777, for a loss of 15%.
Many investors recall a previous "Lost Decade" for the stock market when the market stayed flat to somewhat down, moving sideways but never persistently up, and what is seen in yellow is consistent with that market perception. Except - a 15% loss in a long-term sideways market isn't what happened at all, not when we look at what a dollar would buy. That is, a US dollar in 1982 was only worth 35 cents compared to what it would have bought in 1968, because the dollar had lost 65% of its value to inflation. As shown in blue in the graph, when we adjust the August, 1982 Dow index of 777 to account for a dollar being worth 35 cents, then the real value of the Dow drops to 274. So when we consider the purchasing power of the dollar, then our stock portfolio wasn't remotely close to flat, but rather had dropped by a staggering 70% in fourteen years, from 919 to 274. This 70% decline in the value of what our assets would buy for us was entirely real, but to this day, many of us don't realize just how bad it was - because inflation in prices was hiding deflation in investment values. The 65% plunge in the value of the dollar "hid" the great majority of the 70% plunge in the value of stocks, with most of the surface value of the Dow index by 1982 consisting of dollars that were worth far less than what they had been before. Three False Peaks & Inflation Hiding DeflationEven though long-term asset deflation of 70% (in real terms) was the result of the last time we had persistent high unemployment coupled with inflation, many investors and newspaper readers of a certain age may not remember the 1970s that way at all. Instead they may recall three powerful bull markets when the Dow repeatedly flirted with the "magical" 1,000 mark. Each surge filled innumerable financial columns with the hopes that the good times and a long term bull market had returned again, with those hopes being quickly dashed as the market repeatedly proved unable to sustain itself above the 1,000 level. The reality is that there never were three bull markets, but rather only an inflationary illusion fooling the public. Indeed when we look closely, instead of seeing three peaks, we will see three historical object lessons in how destroying the value of money can hide the destruction of the value of assets - and repeatedly fool the headline writers along with much of the investing public.
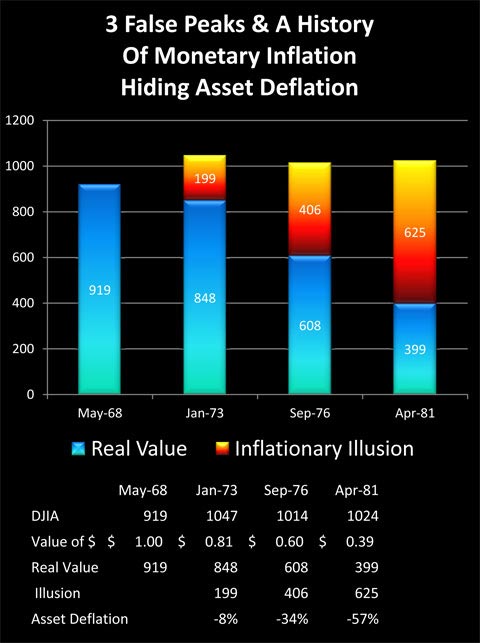
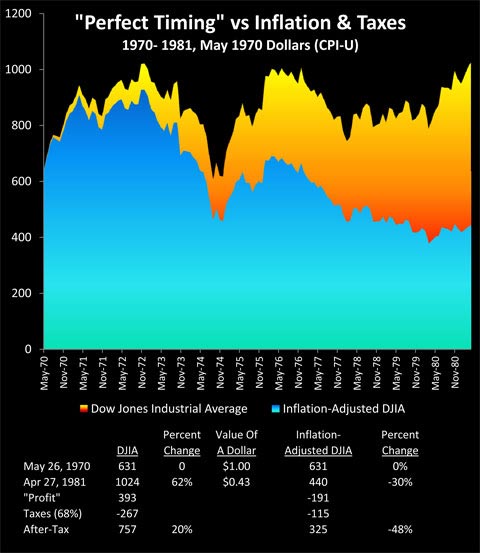
The cold reality of the Dow adjusted for inflation is shown in blue. There aren't three interim peaks, but merely a market moving steadily and powerfully down. The "bull market" that peaked in January of 1973 when the Dow hit 1,047 - was in a reality a fall to Dow 848 (asset deflation in inflation-adjusted terms), that was masked by the dollar being worth only 81 cents when compared to May of 1968 (monetary inflation). Inflation had created an almost 200 point illusion in the Dow. The "bull market" that peaked in September of 1976 at 1,014, really represented the Dow falling by over 300 points - translating to asset deflation of 34% - which was hidden from savers by the illusory profit created as a result of the dollar dropping in value by 40% (monetary inflation). The cruelest illusion of all was the "bull market" of April of 1981, when the Dow finally reached 1,024. Because the real value of the market had fallen to 399, and a 57% destruction of the purchasing power of investor assets was being entirely hidden by the 61% destruction of the value of investor dollars. Fully understanding this relationship of simultaneous monetary inflation and asset deflation is absolutely essential for financial survival, because there is a very good chance that we may all be seeing the greatest "bull market" in stocks that we have ever seen in the years ahead. (We will use "monetary inflation" interchangeably with "price inflation" herein.) Three Wealth Destroyers vs "Perfect Timing"In my opinion, the greatest threat to long-term and retirement investors is the wealth-destroying triple combination of monetary inflation, asset deflation, and inflation taxes. One of the most common investor approaches to a truly difficult market is to attempt to "outrun" the problems. Just make better decisions than the rest of the public, and make so much money that the problems can be overcome and wealth kept intact. How well does that work in practice and just how good do you (or your financial advisor) have to be? To answer that question, we will go back in history and assume that through the use of a time machine (or peerless skill, or uncanny luck) we did a perfect job of long-term market timing during an environment of asset deflation and monetary inflation. Aided by this time machine, we put every dollar we had into the market on May 26, 1970, when the Dow closed at 631. What makes this day remarkable is that 631 is the lowest level the Dow index closed at between November 20, 1962 and September 12, 1974. It was the single cheapest day to buy stocks over an almost 12 year time period, and at the time, the lowest that stock prices had been at in more than 7 years. Perfection. Subject to the conditions that 1) as long-term investors we need to be in the market ten or more years, and 2) that we want to stay within the 1968 - 1982 period of sustained asset deflation and high monetary inflation, we instruct our time machine to find the best possible place to sell. This turns out to be April 27, 1981, when the Dow closed at 1,024. April 27, 1981 was the single highest close for the Dow index between January 22, 1973 and October 19th, 1982. So we buy in on the exact day with the lowest stock prices in an almost 12 year period, and we sell everything out on the exact day with the highest prices over an almost a ten year period. Double perfection! So then, how did we do? As shown in the following graph, which begins on our purchase date and ends on our sale date - our time machine allowed us to get the best possible results in a thoroughly bad market. If our returns had exactly tracked the Dow between when we bought and sold, our perfect timing would have taken us from 631 to 1024, for a 62% price gain in the midst of one of the worst markets in memory.
A whopping profit indeed! Before we adjust for inflation, that is, so let's do that. A dollar on our sale date in April of 1981 was only worth 43 cents compared to what it was worth on our purchase date in 1970. When we adjust for what our assets will buy for us - we have Dow 440, not Dow 1024. So even the perfect timing delivered by our time machine leads to a 30% asset deflation loss in real terms, not a 62% gain. The Internal Revenue Service did not "see" these losses, however, but on the contrary, was quite impressed by our remarkable investment prowess. Moreover, taxes were higher back then (when we confine ourselves to federal income tax rates, we truly are at a low level now compared to much of the modern era). Assuming we were in the highest income tax bracket, and traded often enough to pay ordinary income tax rates, then given that the average top income tax rate over that period was 68%, this means that we would have paid out 267 in taxes on our 393 gain. These taxes on effectively non-existent income are known to economists as "inflation taxes", and during times of high inflation, they can be devastating. Subtracting out real taxes on imaginary income leaves us with Dow 757 in after-tax terms, and Dow 325 in after-inflation and after-tax terms. Thus, even with our quite unrealistic assumption of absolutely perfect market timing - which allowed us to radically outperform almost every other investor in the nation - we still lost almost half (48%) of the purchasing power of our net worth. Lessons Learned & Implications For TodayThe most important takeaway from our time machine scenario is not about 1970 or 1981, but about what investors face today. The world has changed immensely, and there are numerous reasons to fear that long term asset deflation could become reality again. And with the fight for survival of both governments and banking systems, that are each effectively dependent on rampant monetary creation and deficits without end - the chances for major inflation have never been higher in the modern era. History does show what can happen next for an entire nation with a deeply troubled economy. For more than decade, the markets and investor wealth can be dominated by the deadly combination of:
Moreover, history shows us quite clearly that when all three of these major wealth destroyers are working together in the real world - conventional investing methods cannot withstand the destruction of investor wealth that occurs across the nation and over the long term. Even when we used the extraordinary assumption of perfection in timing - there was still a crippling asset price loss in real terms. Of course, real world investors who didn't have the benefit of assumed perfect timing almost all lost even more money. There was very little one could do about it then - nor is there today - so long as conventional investment practices are followed. That placid and theoretical world of ever-compounding retirement investment accounts simply doesn't have a chance when it runs into the real-world triple wealth destroyers that aren't factored into the usual financial modeling assumptions. The second half of this article takes a current-day look at how the combination of asset deflation, price inflation and inflation taxes could produce both Dow 36,000 and devastating market-wide investor losses. A fundamentally different approach to preserving wealth is suggested, which is using three reversals of the redistribution of wealth in order to turn three wealth destroyers into three wealth creators. Current Asset Deflation RisksTo illustrate the extent of the danger for today's investors when the destruction of the value of money (price inflation) hides the destruction of the value of assets (asset deflation), let's begin by assuming that the markets experience a 70% real loss, which is the same as what actually happened between the late 60s and early 80s. Using a round 12,000 for the value of the DJIA, that would translate to an index value - before inflation - of 3,600. However, we must keep in mind that much is different now when compared to this previous bout of asset deflation. For example, Europe was not then on the verge of possible financial system failure, thereby endangering US export markets, jobs and corporate profits in a globalized world. Moreover, Asia had not yet become the world's global manufacturer, so there were still plenty of US manufacturing jobs to be filled when the economy did turn around. Perhaps most importantly, there was an oncoming surge of free-spending young adults - the Baby Boomers - who as consumers and workers would turn the US economy around in the early 80s. This has now been reversed, with the Boomers becoming a retirement juggernaut who will be simultaneously selling massive amounts of investments into the markets, even as consumption drops with a graying population. Given how much has changed between then and now, a mere repeat of that historical 70% decline might be considered a conservative assumption. Deficits, Debt, "Printing" Money & Higher InflationAs with asset deflation, when it comes to monetary inflation, there are powerful and unfortunate differences between the 1970s and now. The Federal government has had its credit rating downgraded because it is borrowing an amount equal to almost 10% of the total economy each year, with no end in sight, to fund ever-growing government promises. As documented in my article, "Six Layers Of Deficit Impossibilities" (linked here), the current national debt amounts to $152,000 per able-to-pay US household, and the total amount owed increases to $640,000 per household when we include unfunded US government promises to future retirees. The global financial system is being kept from collapse only by the direct creation of trillions of dollars and euros which are being passed to financial institutions and other favored corporate insiders on non-market terms. Impossible promises to retirees and government bond buyers from effectively bankrupt governments are all too likely to be repaid with inflation. If we assume not the historical 65% destruction of the value of money - but a 90% destruction (which is consistent with the Federal Reserve's creating dollars by the trillions out of thin air), then a dollar becomes worth ten cents. As shown below, if a dollar is worth ten cents, then the Dow must rise (in nominal terms) to 36,000, in order for it to be worth 3,600 in real terms.
The illustrated "fiery" rise from Dow 12,000 to Dow 36,000 is spectacular indeed, and is likely to draw the full attention of a keenly interested party - a near bankrupt government that is starved for tax revenues. It is government fiscal and monetary policy that creates inflation; however, inflation losses are not recognized under the tax code. So we owe taxes in full on the 24,000 point rise in the Dow - even though we actually lost 70% of the value of our investments in that rise. Eventually, excessive borrowing and high inflation will restrict the government's ability to use deficit financing, and either the spending must plummet as generations-worth of promises to retirees are broken, or taxes must be substantially increased - or both. Unfortunately, "wealthy" investors who have been enjoying apparently "stratospheric" profits on their retirement investment accounts are likely to be all too tempting of a target, resulting in rising tax rates even while retirement tax shelters are restricted or eliminated.
The above chart assumes a 50% tax rate, which while above recent rates, is still nowhere near the highest levels seen in modern history. Keep in mind that the government may be near bankrupt, with tens of millions of enraged voters not getting the promised level of Social Security benefits they thought they had been paying for with decades of payroll taxes. Paying 12,000 in taxes on a 24,000 point "profit" leaves us with the after-tax equivalent of a 24,000 Dow. When we adjust for a dollar being worth ten cents, we are left with Dow 2,400 - which is only 20% of what we started with. As the chart shows, the illusionary "profits" caused by inflation allow the government to use inflation taxes to take a third of the value of the assets we had left after the 70% bout of asset deflation, leaving us with an 80% loss on our savings. Alternative AssetsA very attractive alternative for many investors is to try to bail out of paper money and paper assets altogether, and to seek to preserve wealth through tangible assets such as precious metals and real estate. Tangible assets can indeed form the cornerstone of successful investment strategies in difficult markets, but unfortunately (and ironically), most popular inflation hedges don't take inflation taxes into account. My article, "Hidden Gold Taxes" (linked below), explores how a combination of high inflation and rising tax rates can devastate what looks like a perfectly executed gold investment strategy, turning what on the surface appears to be spectacular profits into a major loss on an after-inflation and after-tax basis, with the government effectively ending up with much of the gold investor's starting net worth. http://danielamerman.com/articles/GoldTaxes1.htm Precious metals are a great way to survive and even profit during financial turmoil - but inflation taxes have to be fully taken into account in the strategy. The Triple Redistribution Of WealthFortunately, there are solutions. But to apply them, one must first recognize and understand the redistribution of wealth. While the value of the paper dollar did fall by 65% between 1968 and 1982, and the inflation-adjusted value of the paper wealth that is the Dow did fall by 70% - the real wealth of the country as a whole did not fall by 65-70%. For real wealth is not paper assets in a bank or brokerage account, but is goods and services. Real wealth is the economy and the collective standard of living. The economy did not fall, but rather it grew by a cumulative total of 25% in inflation-adjusted terms over those 14 years, with an annual average real growth rate of about 1.6%. The 70s and early 80s were deeply troubled, and this real annual growth rate is about half of the long-term average for the modern era in the United States - but the sum total when it comes to real wealth was still positive. Now, we know that tens of millions of savers who were relying on their savings to at least partially pay for their standard of living did necessarily see a fall in their standard of living - because what their dollars could buy for them did fall by 65%, and after-tax interest payments were not nearly enough to keep up. However, this dramatic drop in potential standard of living was not experienced by the nation as a whole. Rather, there was necessarily a redistribution of wealth - with tens of millions of other people benefitting (albeit accidentally in most cases) from the destruction of the paper dollar that was severely hurting tens of millions of savers. We also know that there were indeed millions of stock investors who experienced asset deflation savaging the purchasing power of their portfolios. Because the value of paper wealth in the form of stocks fell by 70% - while overall real wealth grew for the nation - there was indeed a major redistribution of the relative rights to enjoy this real wealth of goods and services. Inflation taxes are, of course, a major redistribution of wealth. Government economic policy creates inflation, while government tax policy pretends inflation doesn't exist. Through taxes, massive illusionary profits are taken from savers and investors, and redistributed by the government. When inflation is high, inflation taxes act as lead weights, pulling down and even crippling the performance of most inflation hedges and general investment strategies alike - until one realizes that they are created by government blindness to inflation. On a fundamental level, this blindness necessarily opens the door to out-of-the-box counterstrategies for achieving profits that are in plain sight - even if government tax policy doesn't see them. Turning Wealth Destroyers Into Wealth Creators
The end result is the impoverishment of savers and investors by the tens of millions. And because the great majority of paper assets are held by older people, it will be the Boomers and their parents who pay the highest costs, as wealth is redistributed away from them. I have spent many years studying these issues and exploring different possible solutions. And over these years I have become convinced that the best answers can only be found by first finding the right questions to ask. The essential questions aren't about how to achieve the best results within a conventional long-term investment approach. Because as we saw with the "perfect timing" scenario, when broad and powerful wealth destroyers are moving against all investors, and on a sustained basis - then coming out ahead becomes excruciatingly difficult, and in the real world will likely only be achieved by a tiny fraction of investors. Instead, let me suggest that the better approach is to move to a more fundamental and holistic level, taking into account everything that determines our net worth and standard of living, and asking the three following questions:
These are not the usual questions. But they are the essential questions. Because when we successfully answer all three questions, and reverse all three wealth destroyers, then we have three wealth creators instead. These wealth creators can then build upon each other, and transform our personal finances in a time when paper wealth is being destroyed all around us. Finding the best answers means stepping well outside the usual approaches, and this will mean that our strategies may look radically different than those around us. Which is exactly what we need, because if sustained high monetary inflation, severe asset deflation and inflation taxes do return - those who do nothing to change their "normal" financial profiles will face year after year of pervasive and sustained financial pain, with declining wealth and potentially declining standards of living. Much like they did before, only on a larger scale this time.
Daniel R. Amerman is a futurist and financial consultant with a unique approach to helping individuals and organizations prepare for and profit from an upcoming time of generational change and likely financial turmoil. He is a Chartered Financial Analyst and former investment banker, with MBA and BSBA degrees in finance and over 20 years of financial experience. |
 |
 |

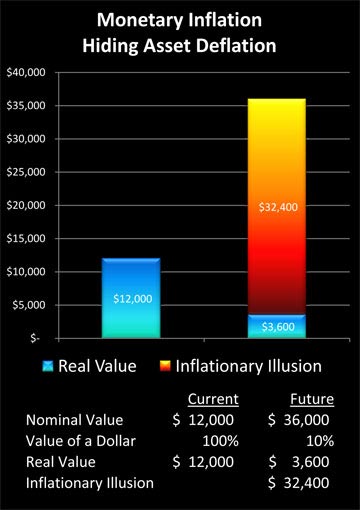 The blue in the graph represents reality, with the purchasing power of our investments dropping 70% from our starting point on the left, to our ending point on the right. However, when we include the "Illusion Of Inflation" in the column on the right, and we combine 70% asset deflation with 90% dollar destruction - then we get Dow 36,000.
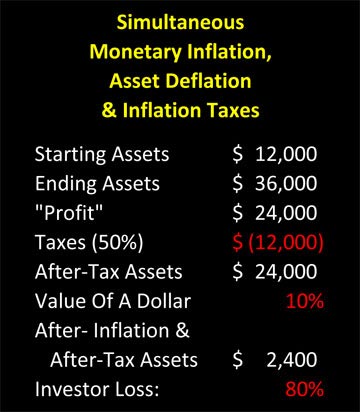
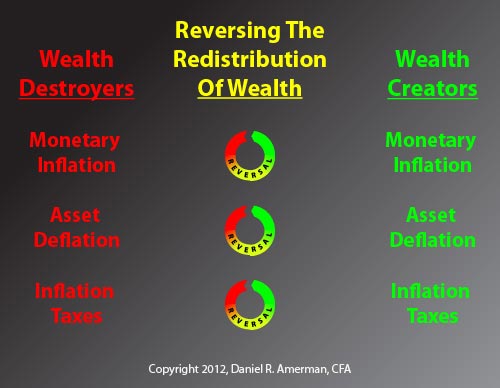 When we put the three wealth destroyers on the left column together - as has happened in the past and may be happening again in the near future - then conventional finance strategies simply can't cope, not once we look at results in after-inflation, after-tax and after-expense terms.